The ontology is Cord’s model of your business: the objects it is made of and how they connect.
Compute capex
Customer economics
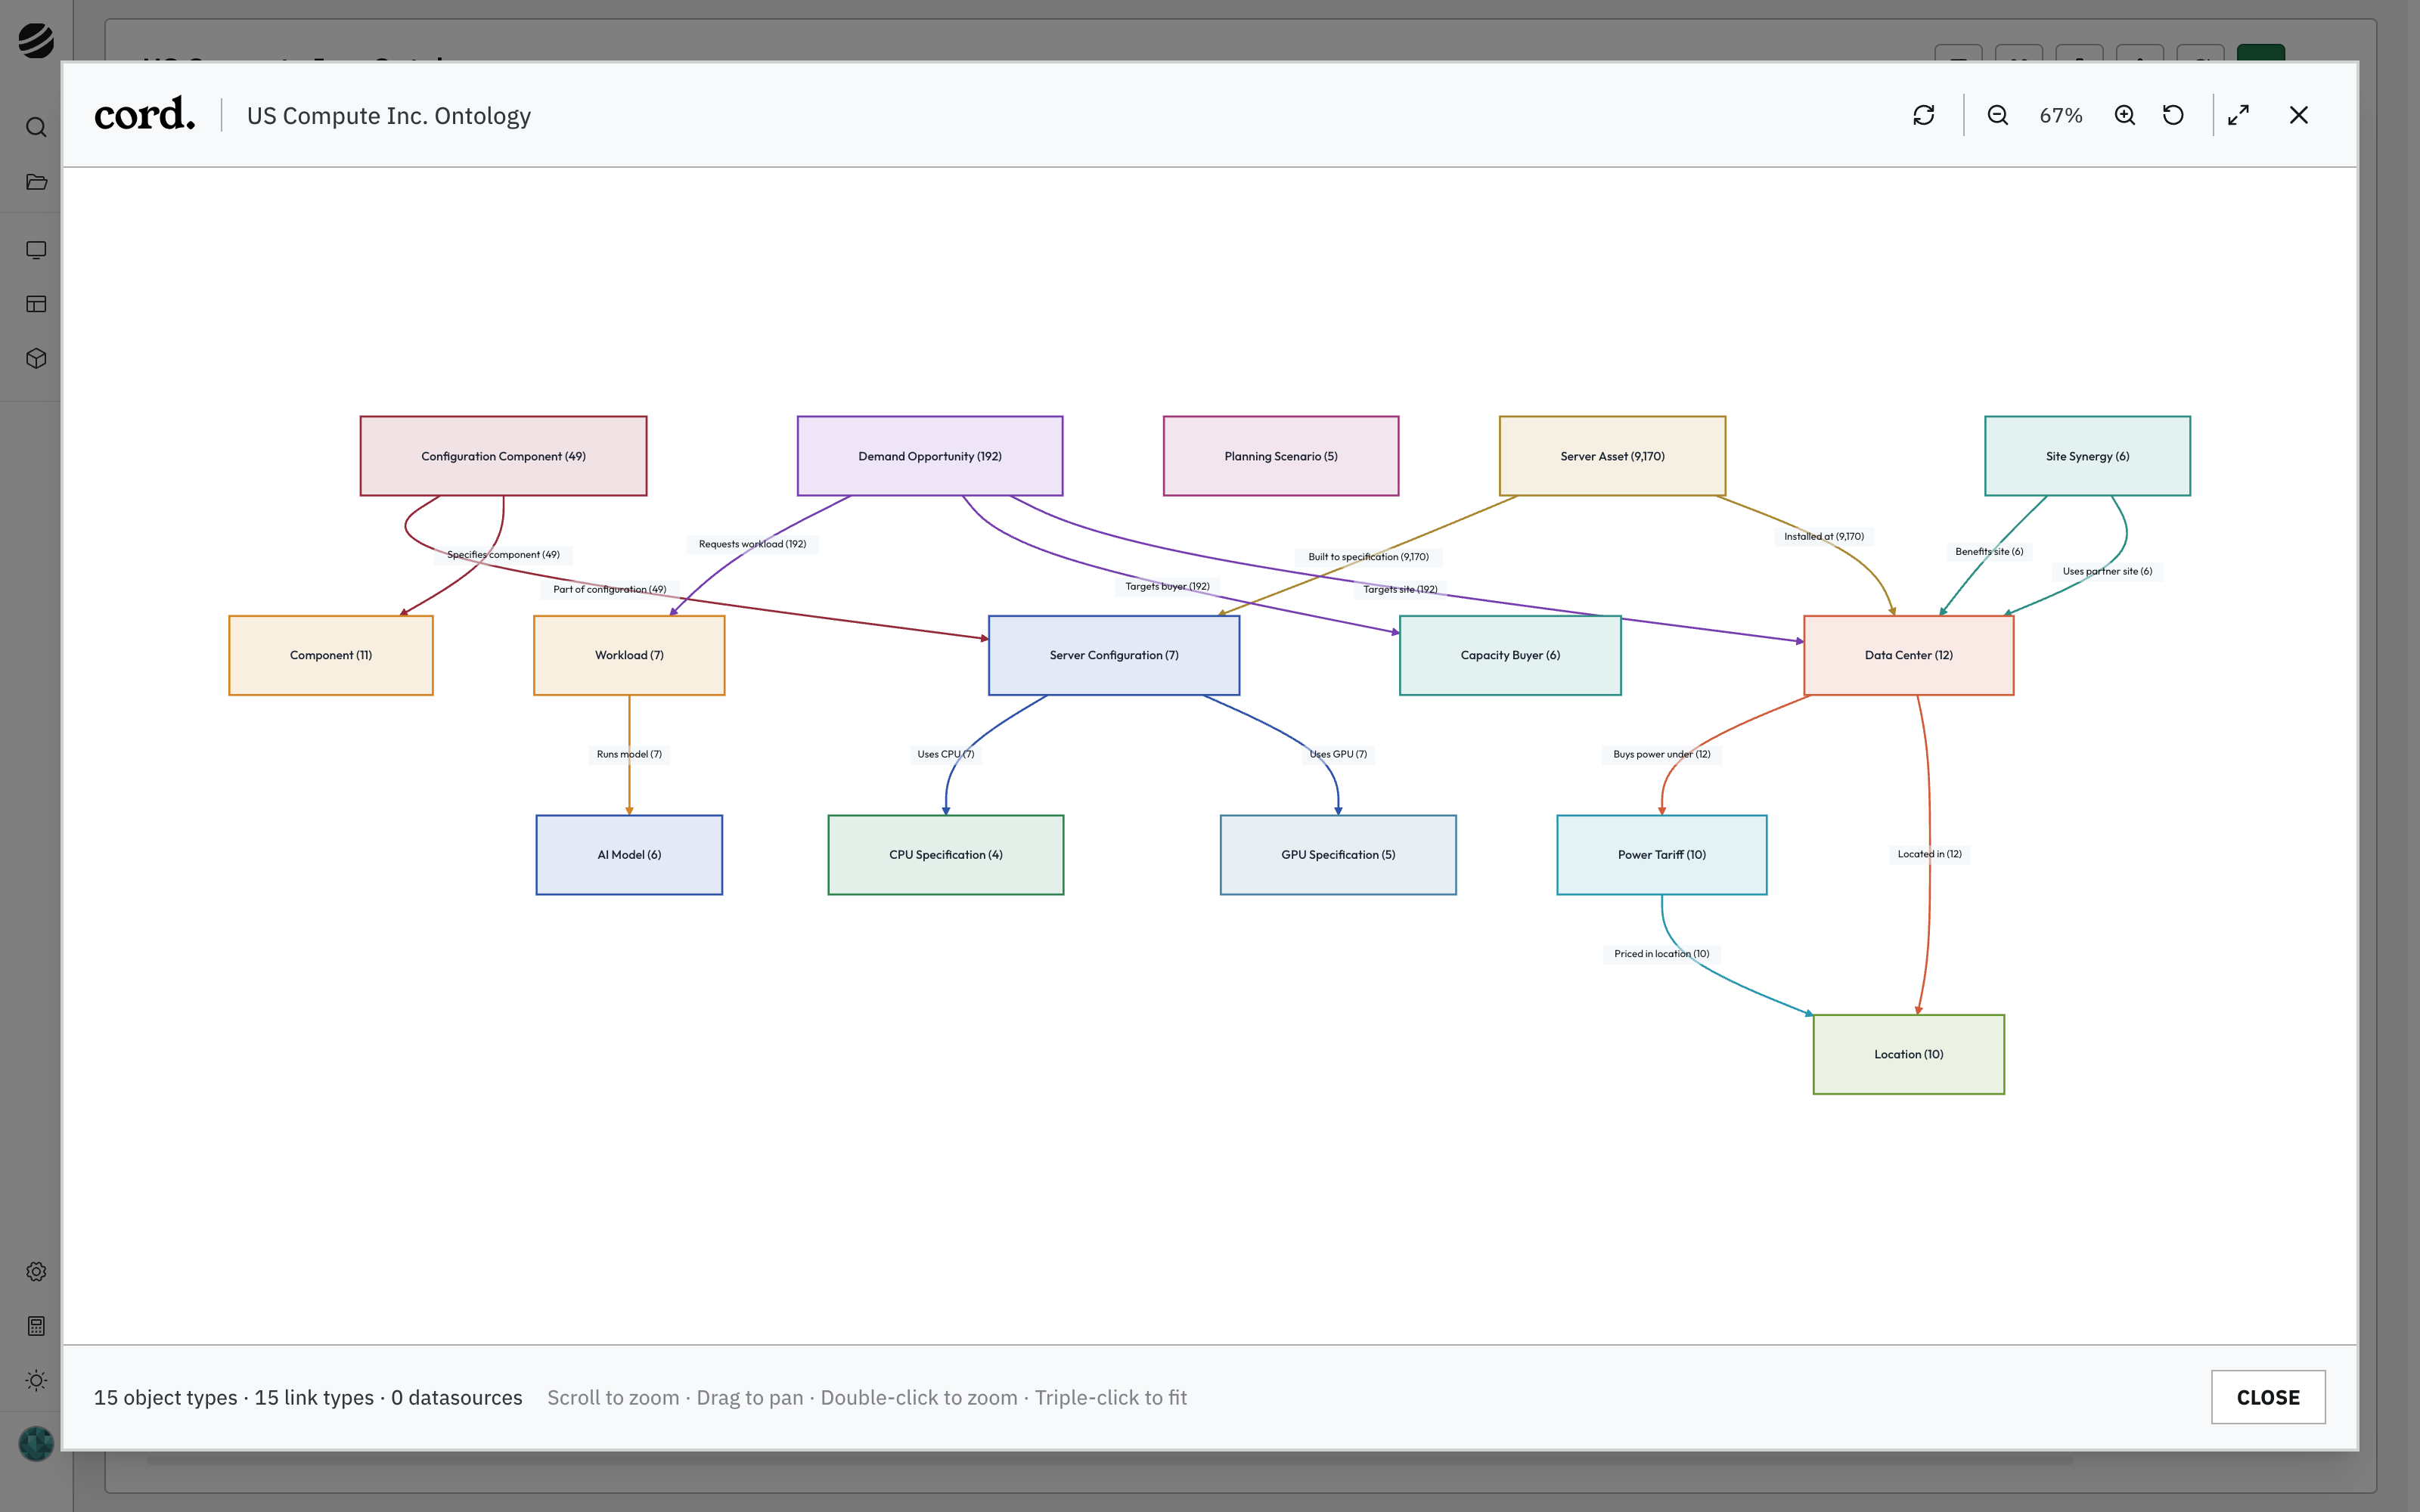
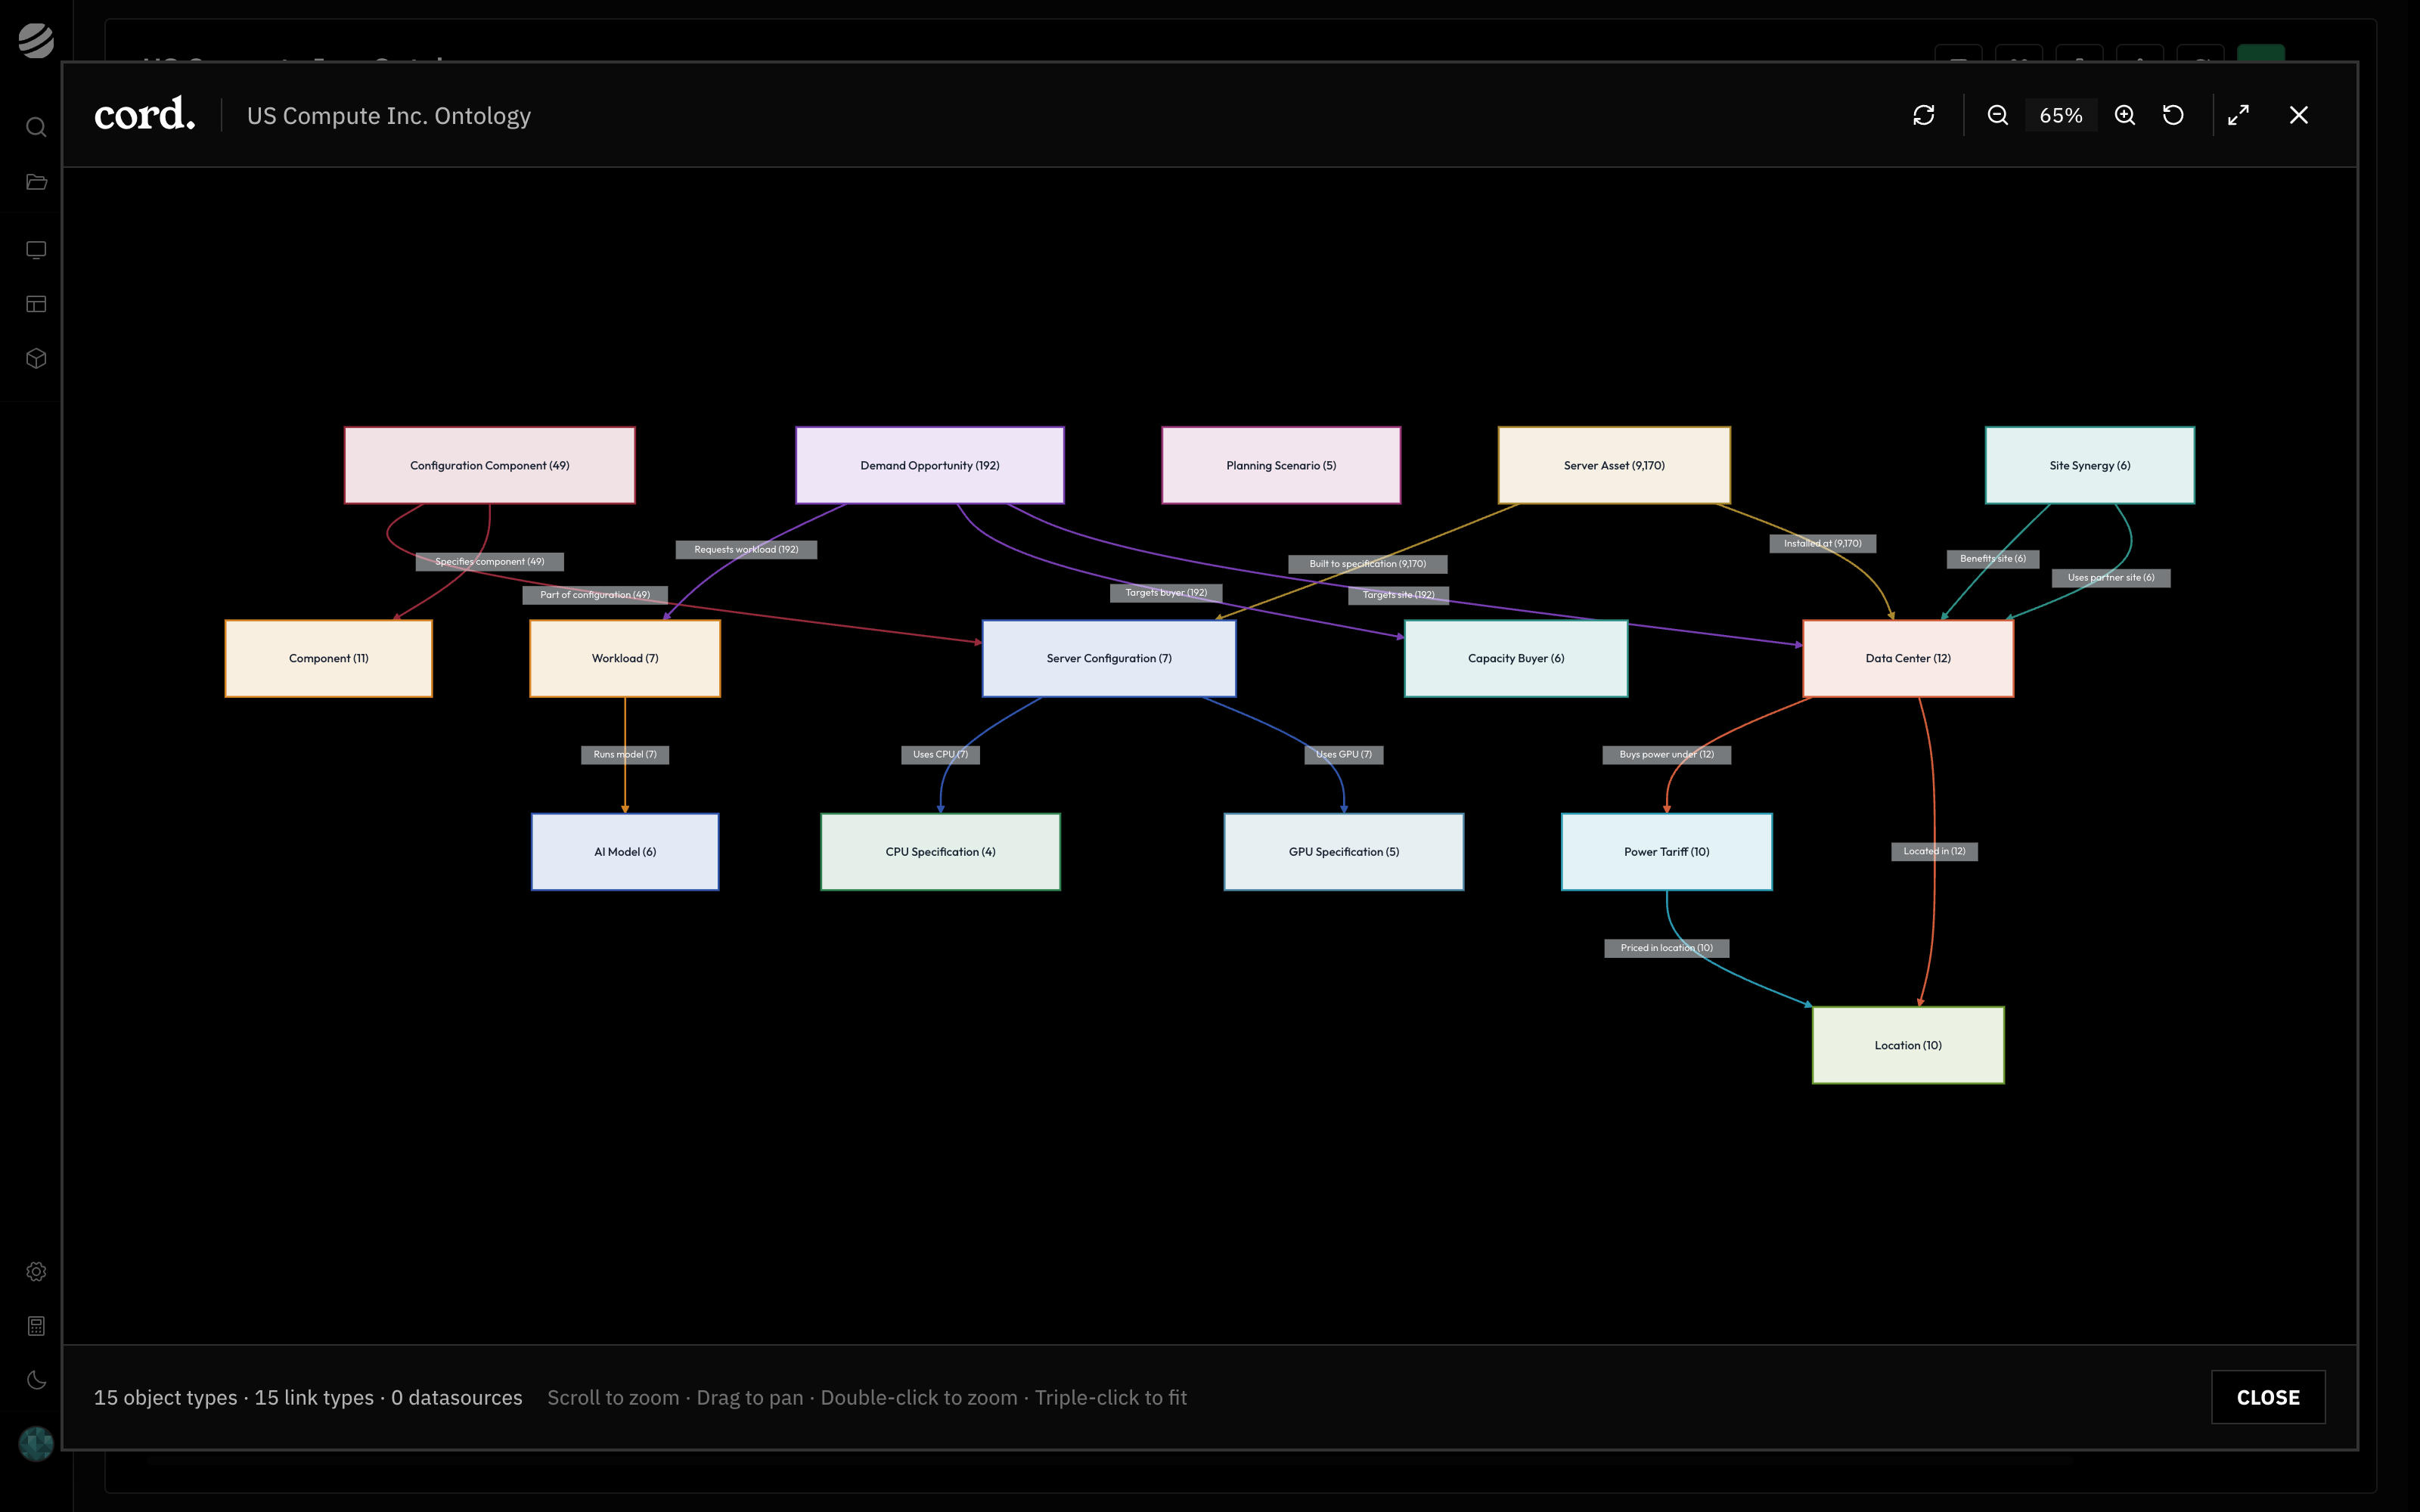
A data center sits in a location and buys power under a tariff priced there. Server assets are installed at the site and built to a server configuration, which uses a GPU and a CPU specification. Demand opportunities target a site and a buyer and request a workload, and each workload runs a model. Planning scenarios and site synergies sit alongside.
Fifteen object types and the relationships between them, in a fictional compute operator.
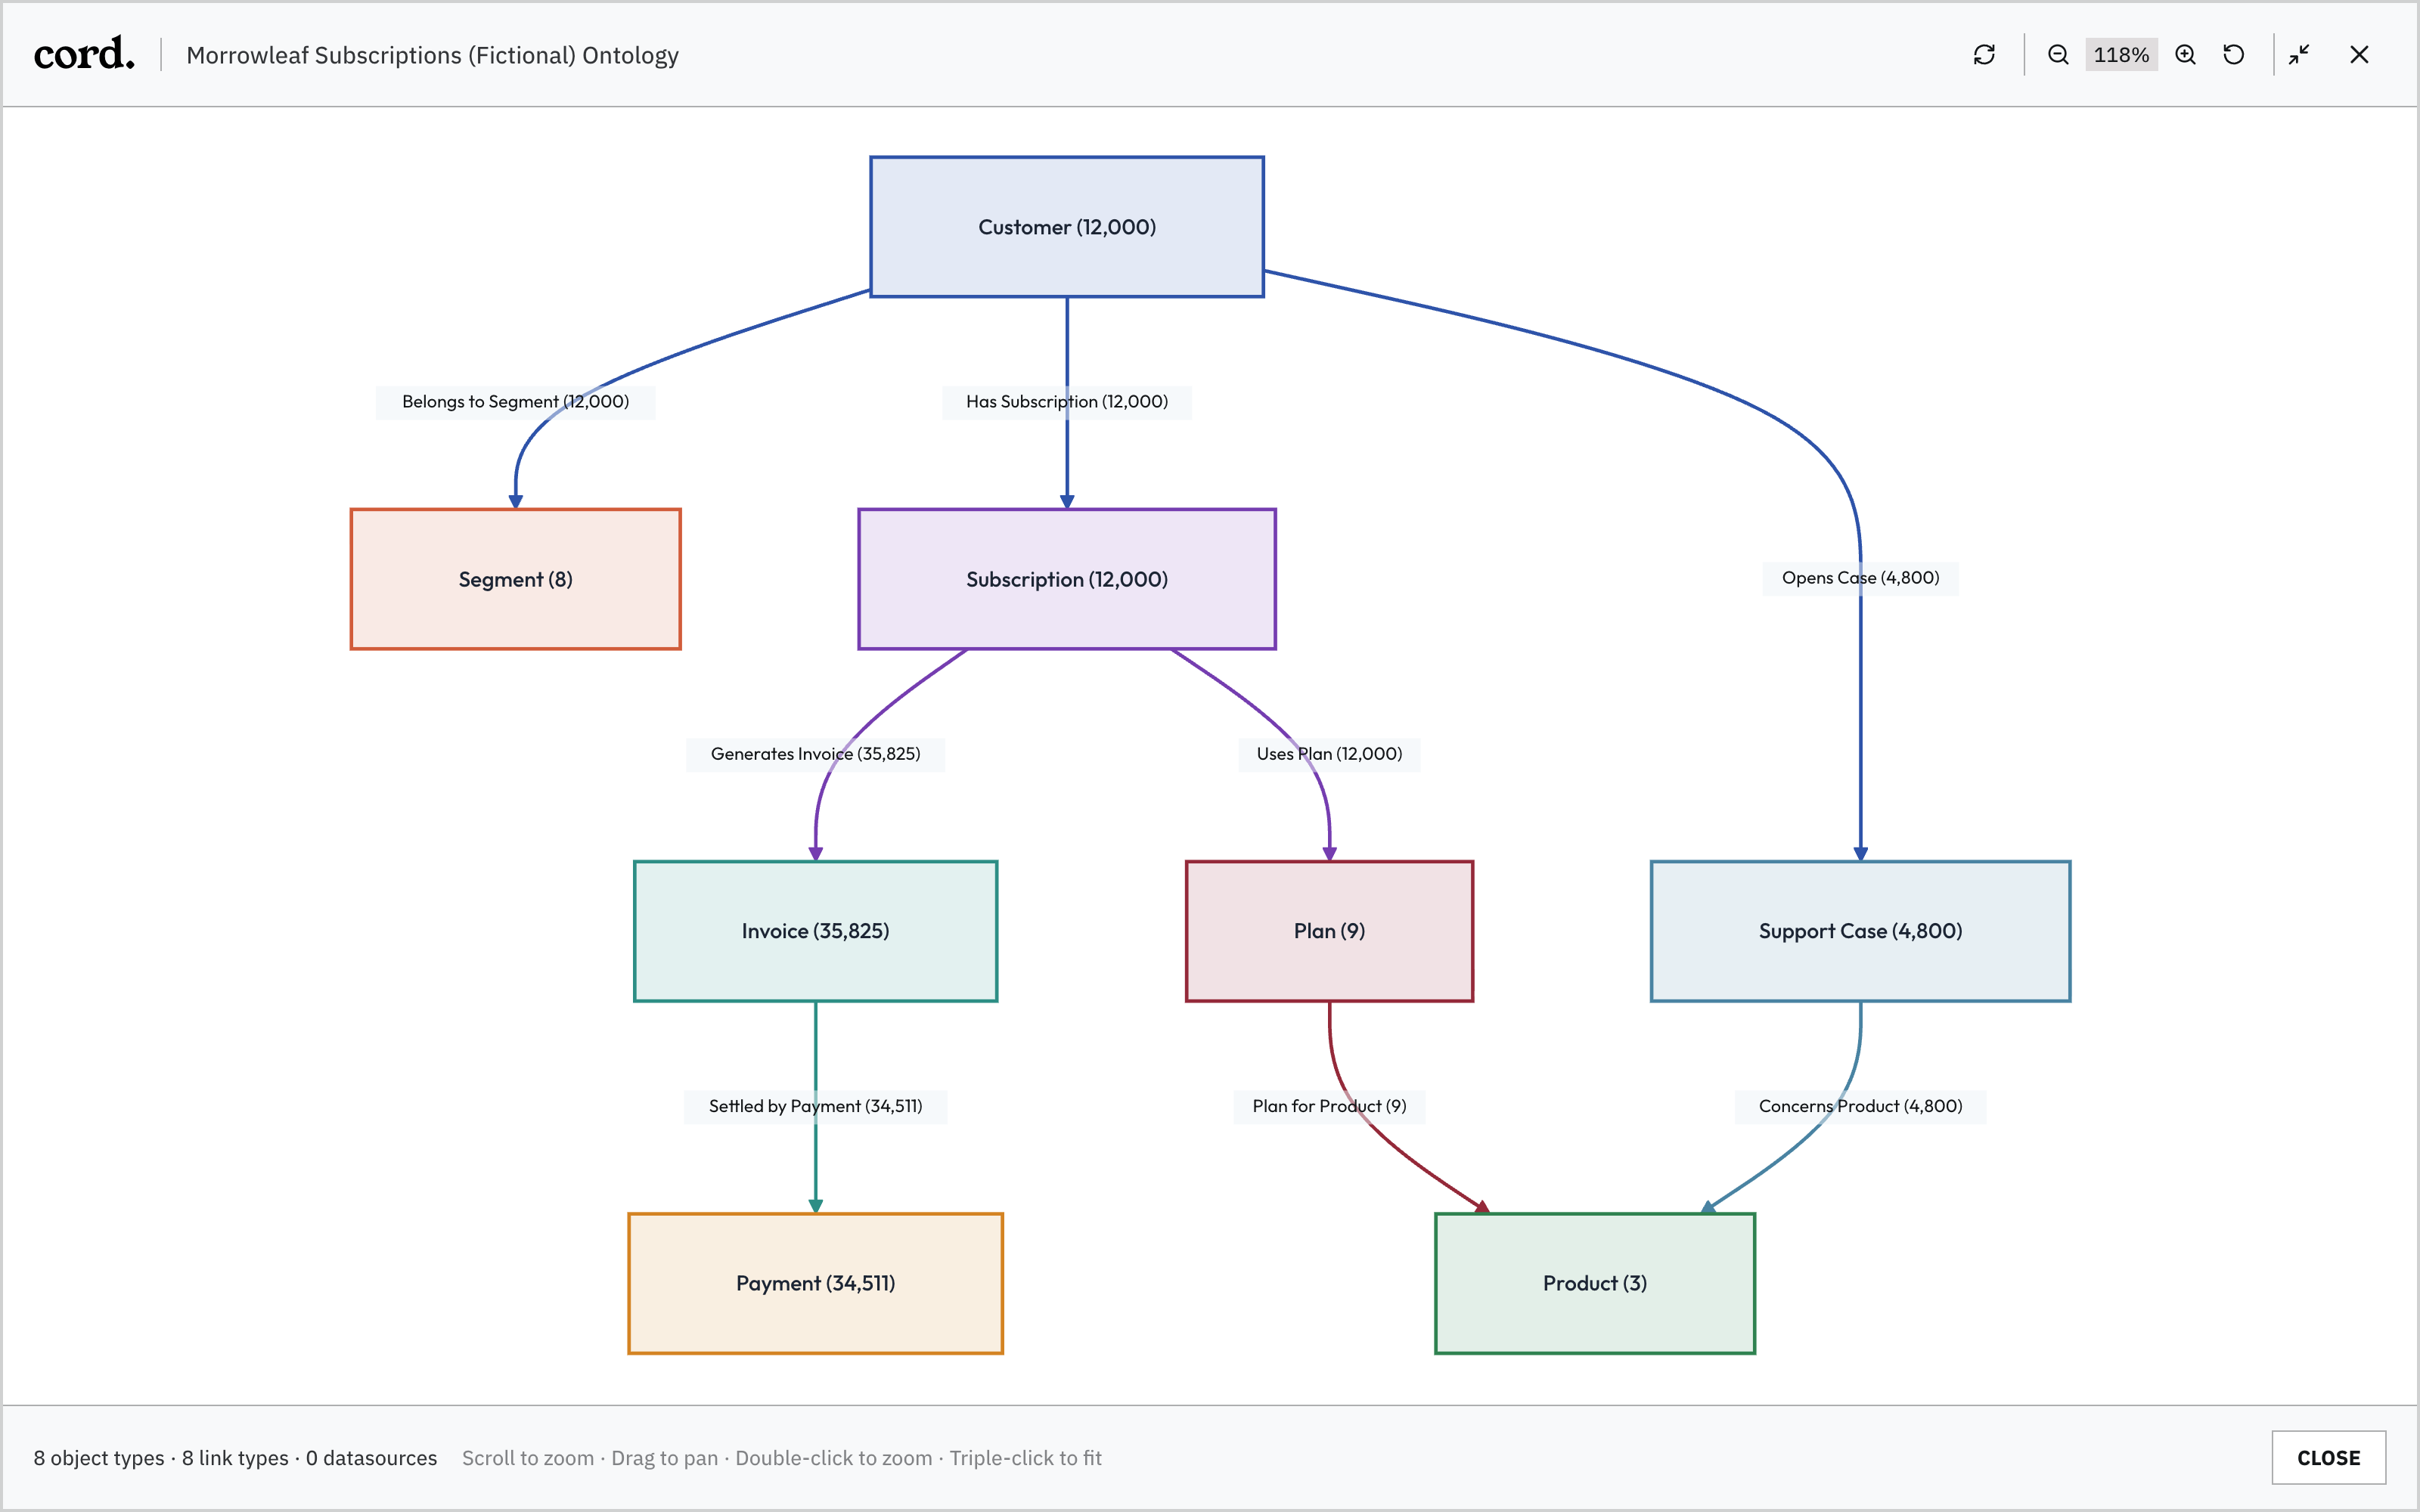
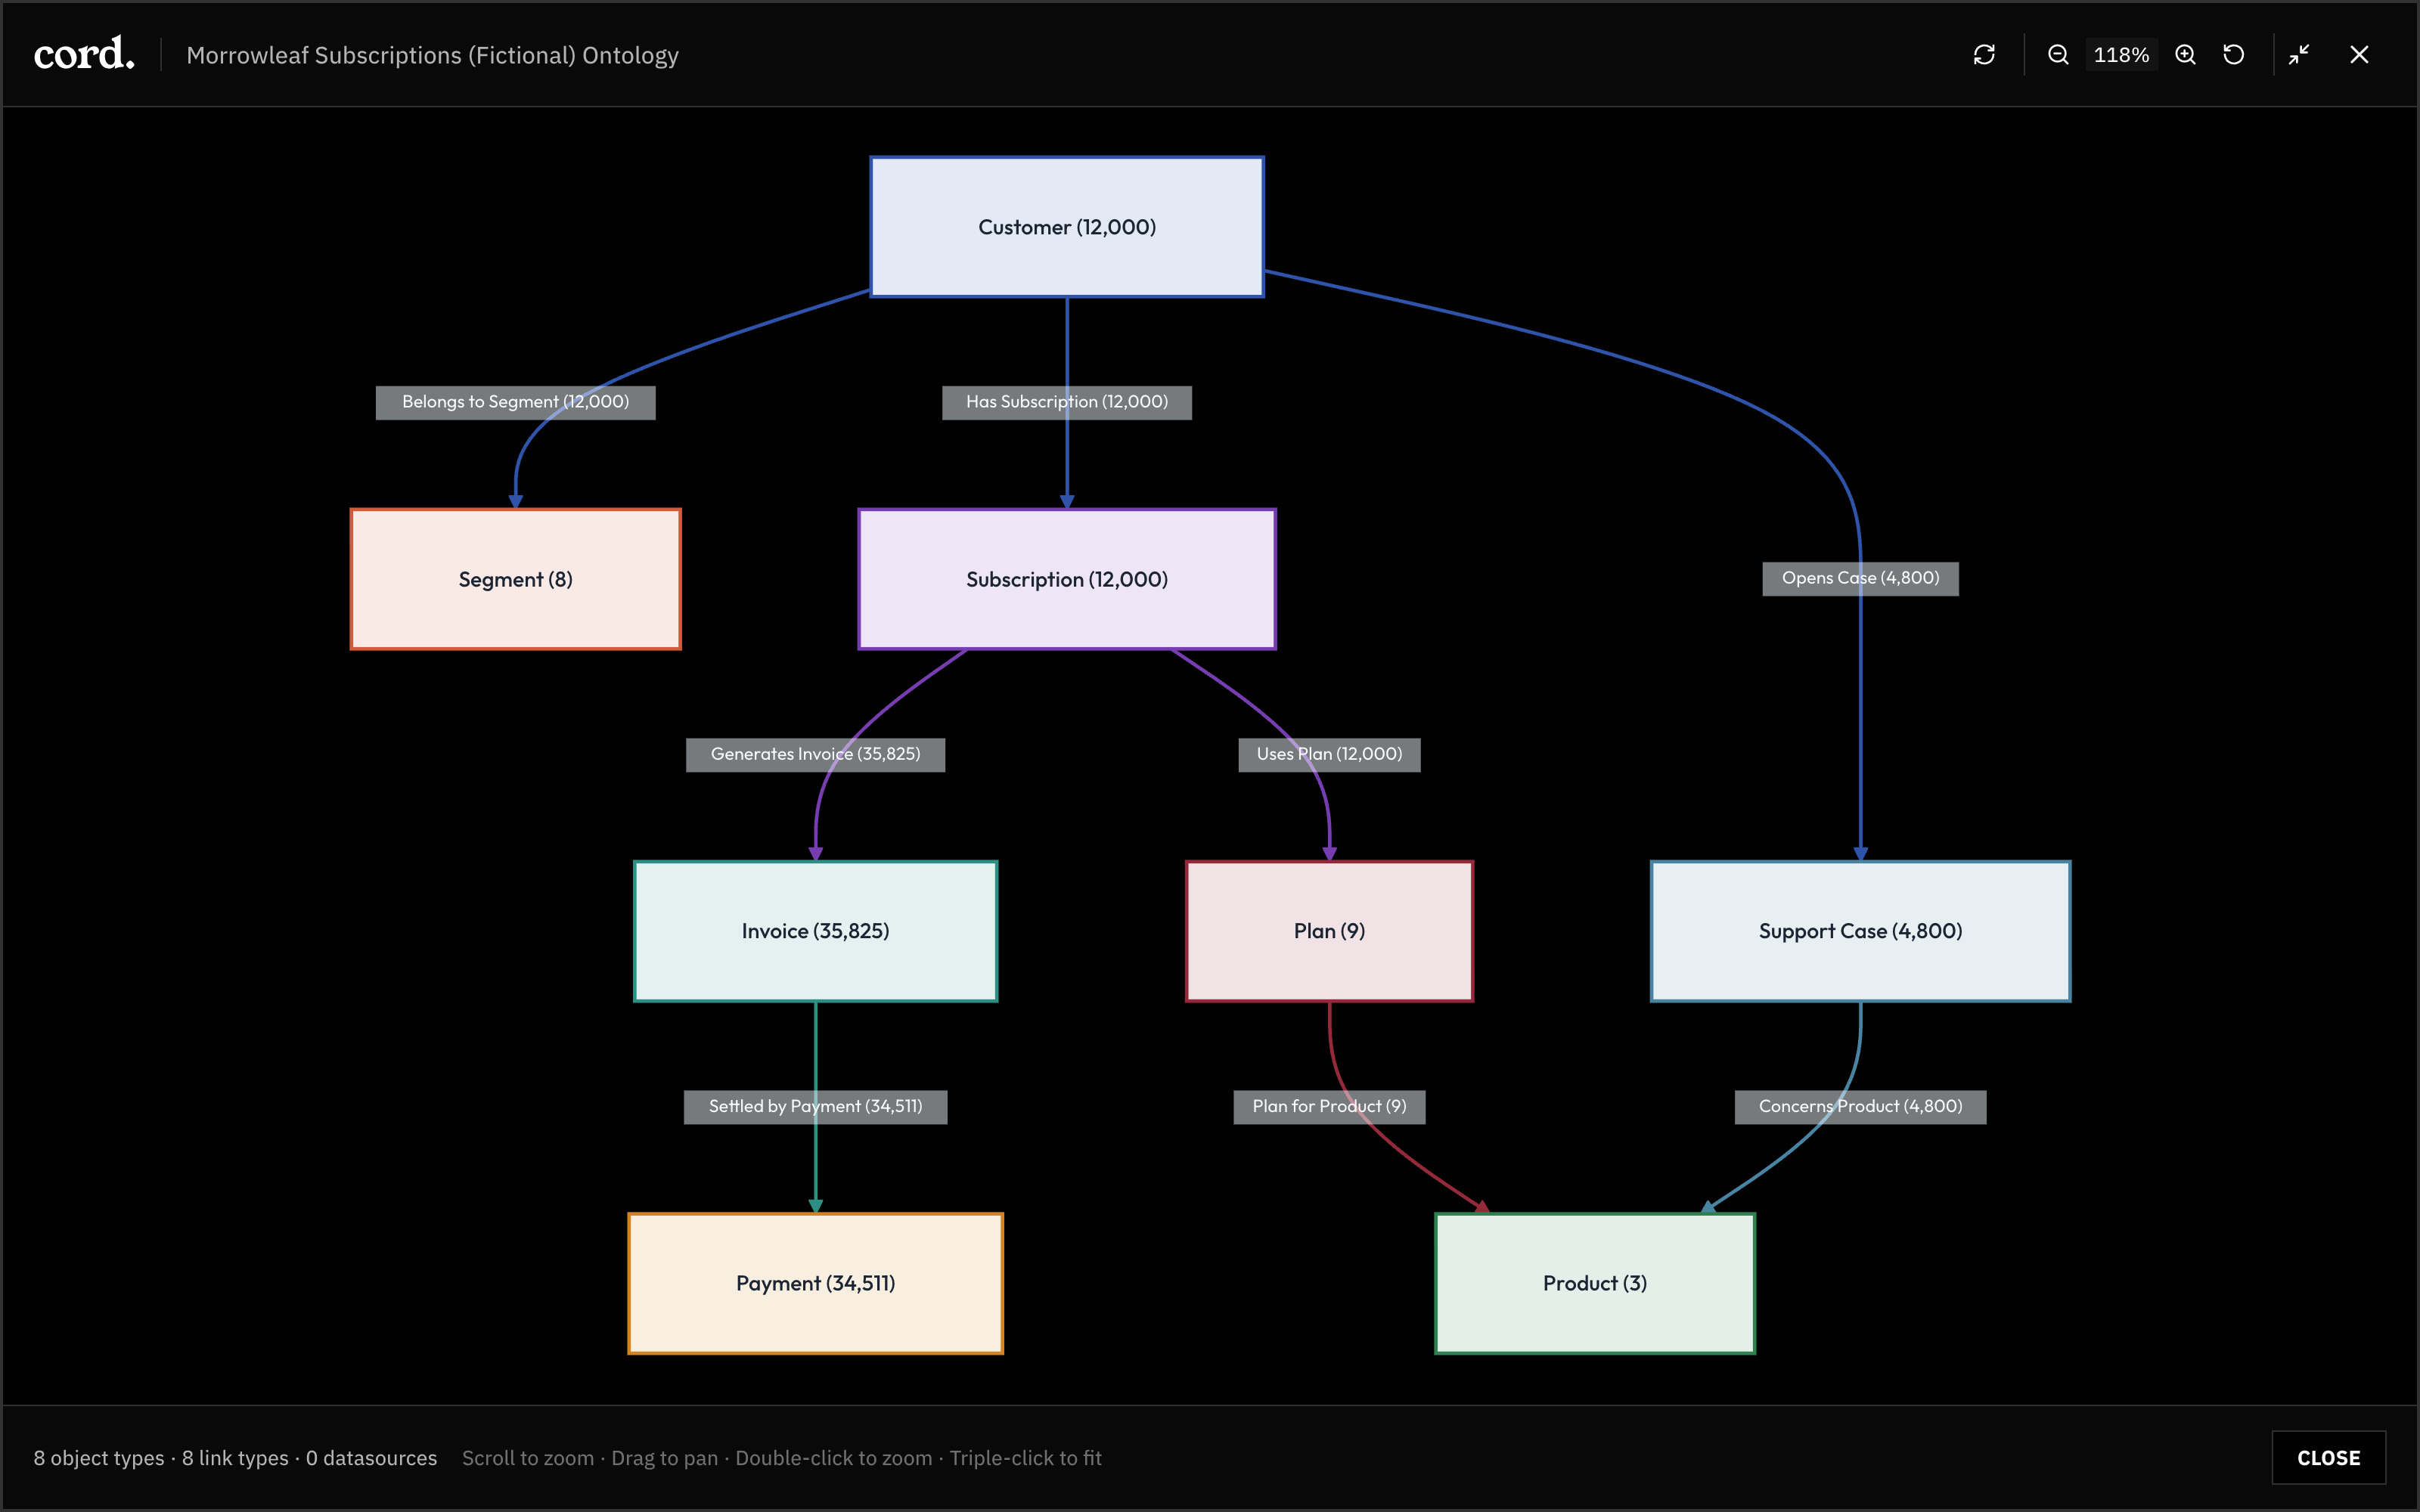
A customer belongs to a segment, holds a subscription, and opens support cases. The subscription generates invoices and uses a plan. Invoices are settled by payments. Plans and support cases both point at a product.
Eight object types and the relationships between them, in a fictional subscription business.
Each object type has named fields and an identifier, and each record keeps a note of where every field came from. Functions compute over this model rather than over the tables underneath it, which is what lets a single calculation reach across systems. Cost to serve a customer reads invoices, payments, and support cases. Break-even for a site reads the data center, its power tariff, and the server configuration it would run. Neither needs to know which system each piece came from.
Your systems stay where they are. Data feeds bring their data into Cord: a warehouse push, a scheduled pull from an operational system, an uploaded file, or an event stream that arrives as things happen. Each feed is shaped by a pipeline and written into object types by a writer that maps columns to fields.The agent builds the model. Given a new source, it reads the tables, proposes the object types and relationships they represent, and lays out a column-by-column mapping. You review the proposal as current versus proposed and apply it. Writers run as a dry run first, so the counts of records created, updated, and unchanged are visible before anything is written.Writers match records by key. The same customer arriving from the CRM and from billing lands on one Customer object, with both source records attached. Where two systems use different identifiers, the pipeline maps them to one key before the writer runs.Mappings and fields can be adjusted afterwards in the Write Manager, which shows every field’s path from source column through the pipeline to the object.
Compute capex
Customer economics
The Write Manager for Server Configuration: each feed column cast, mapped, and keyed on Configuration ID.
The Write Manager: source column, pipeline step, artifact field, and the Customer property it lands in.
Feeds keep the model current, on a schedule or as events arrive, and functions and apps refresh from there. Each new use case adds objects, mappings, and definitions that the next one reuses: adding a new cost line is one more writer onto an object that already exists.
A number in an app can be followed back, step by step, to where it came from: the function that computed it, the objects and fields the function read, the writer mapping behind each field, the feed column, and the source system.
In an app open in Application Studio, Show calculations opens the equation and its operands and links to the function run.
In Functions, the Audit tab maps each output to the objects and fields underneath it.
In the Write Manager, each field maps to its pipeline step and source column.
In chat, a cited number opens a trace panel with the calculation breakdown and the contributing records.
Saved runs keep their version and inputs, so a number from an earlier period reopens as it was computed then.