What a function is
A function is a saved piece of business logic: how contribution is computed, how return on capital is measured, when a project counts as above its hurdle rate. It is written once, and every app that needs the number reads it from there. A function has three parts.How a function gets written and managed
Functions are written and managed by the agent. It works from the business objects involved, writes the logic, runs it, and checks the output. The result comes back with an explanation of what was computed, and the code is visible in the Functions workspace.- Compute capex
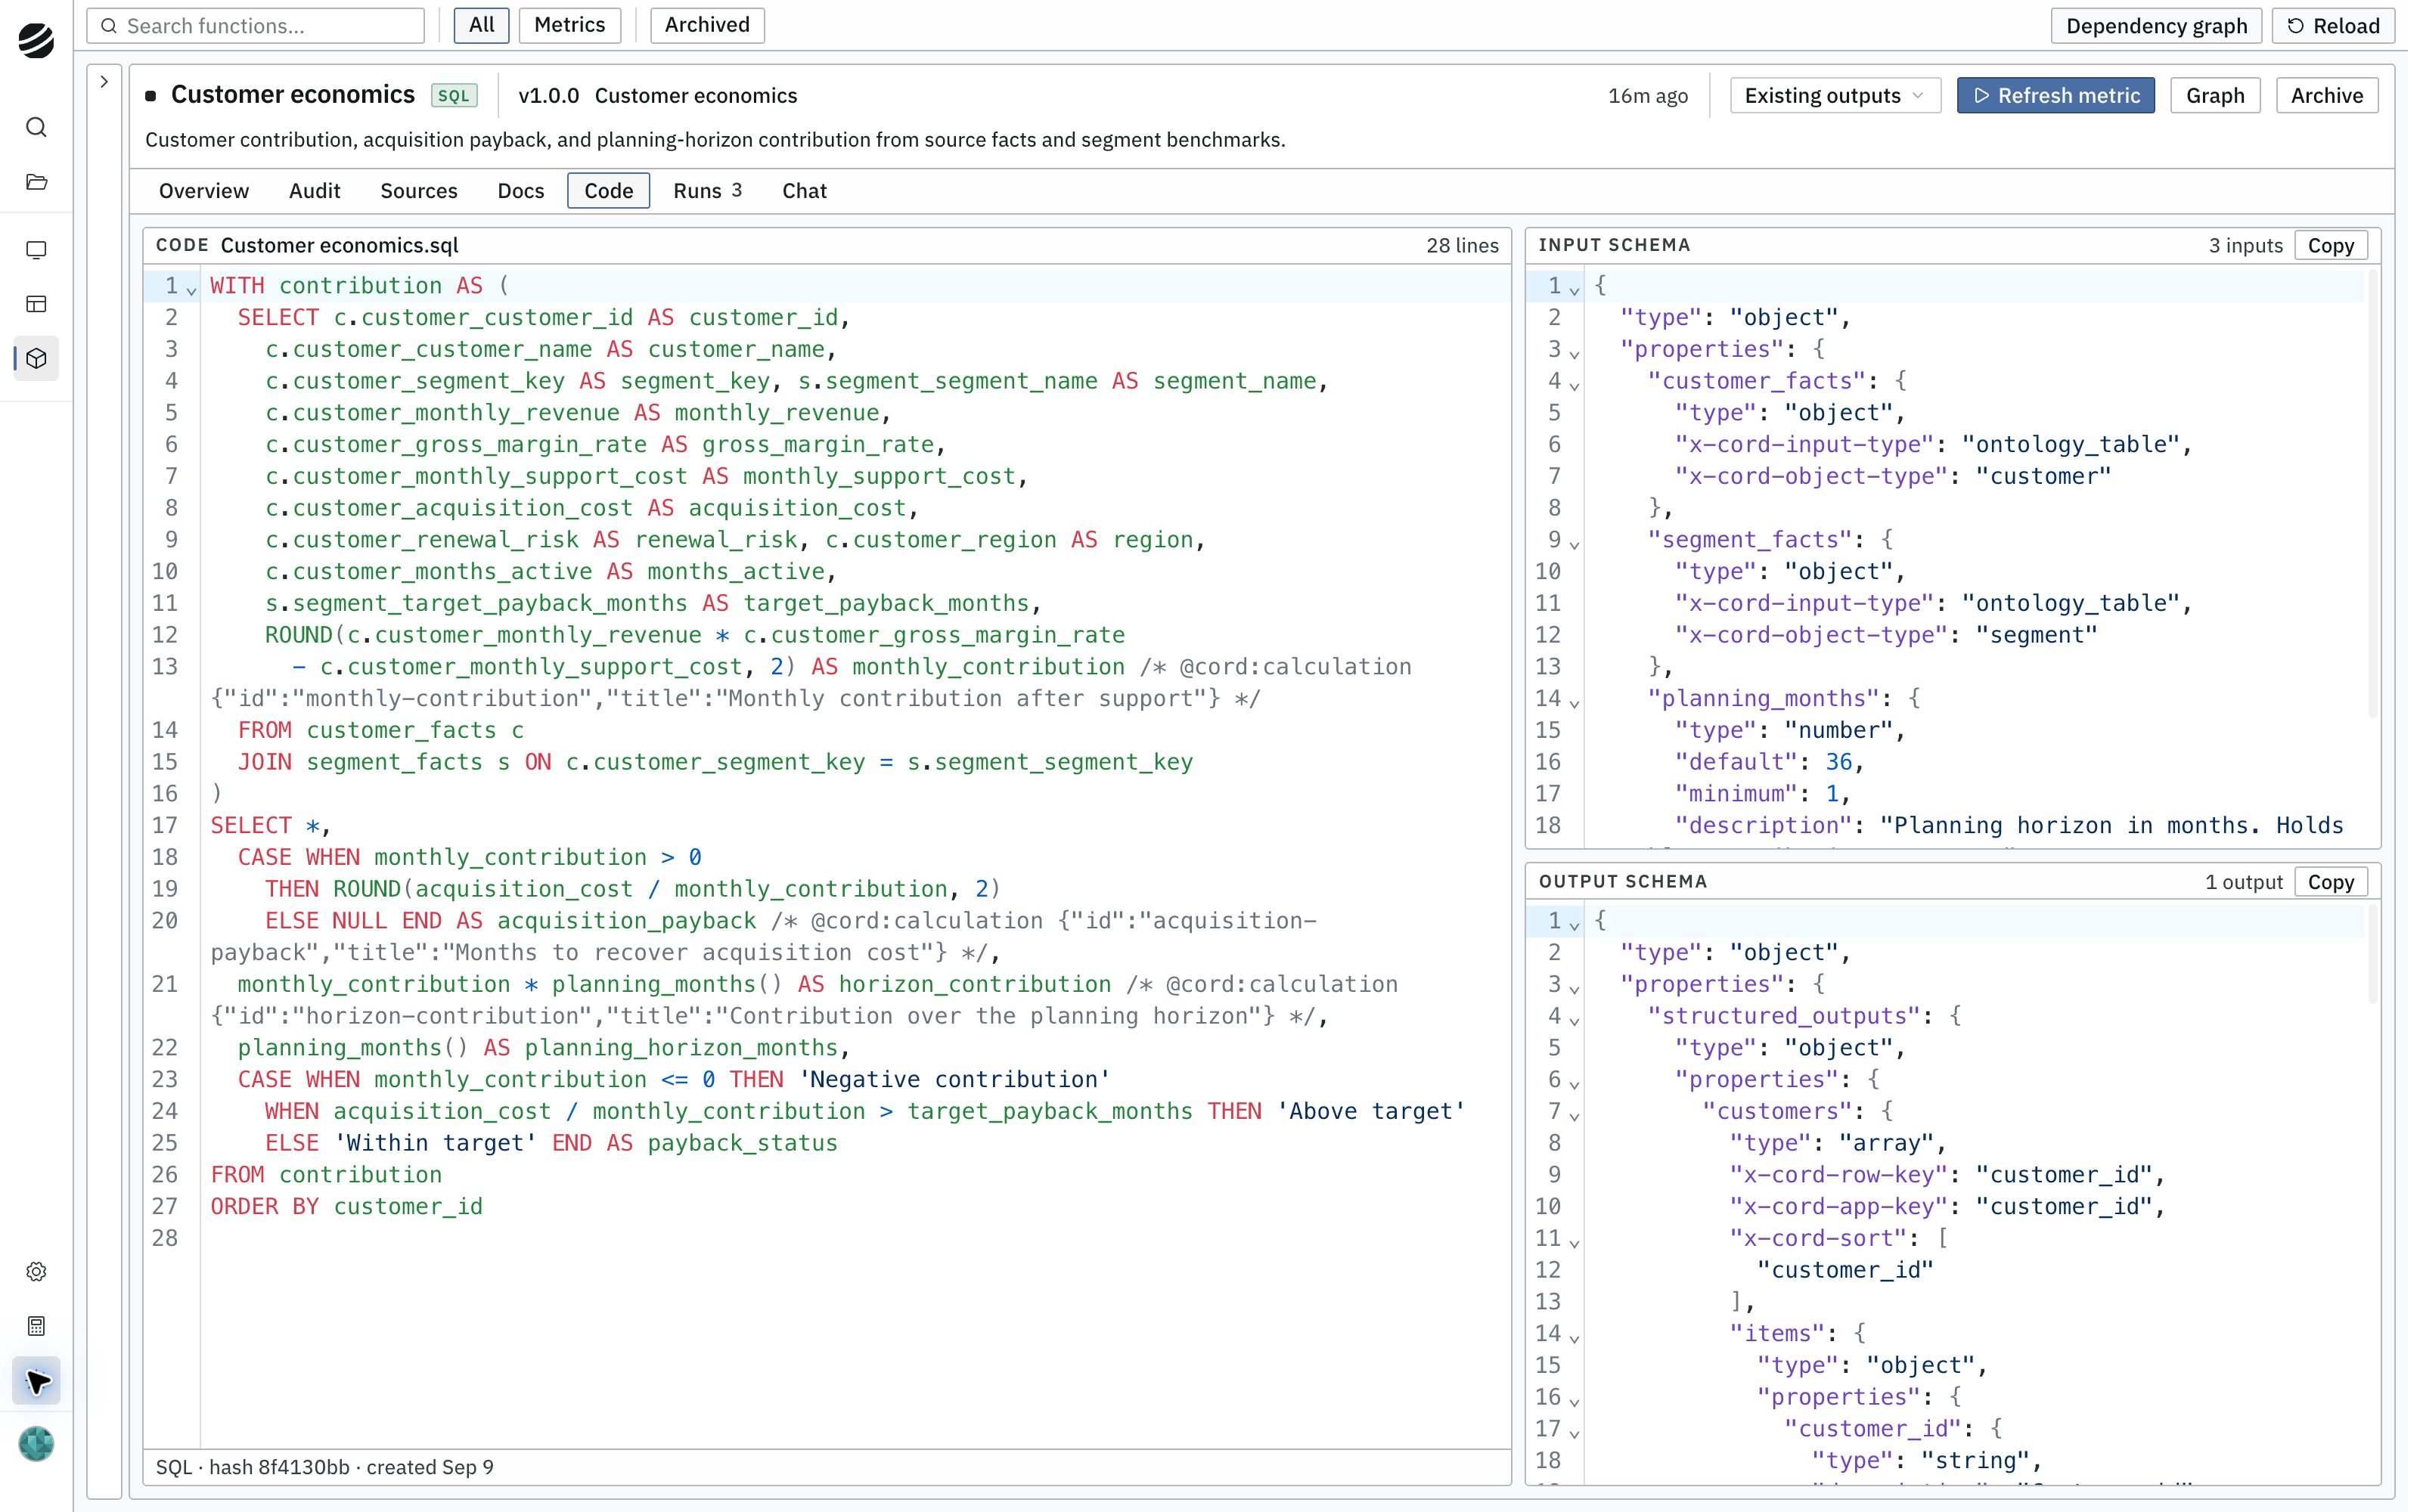
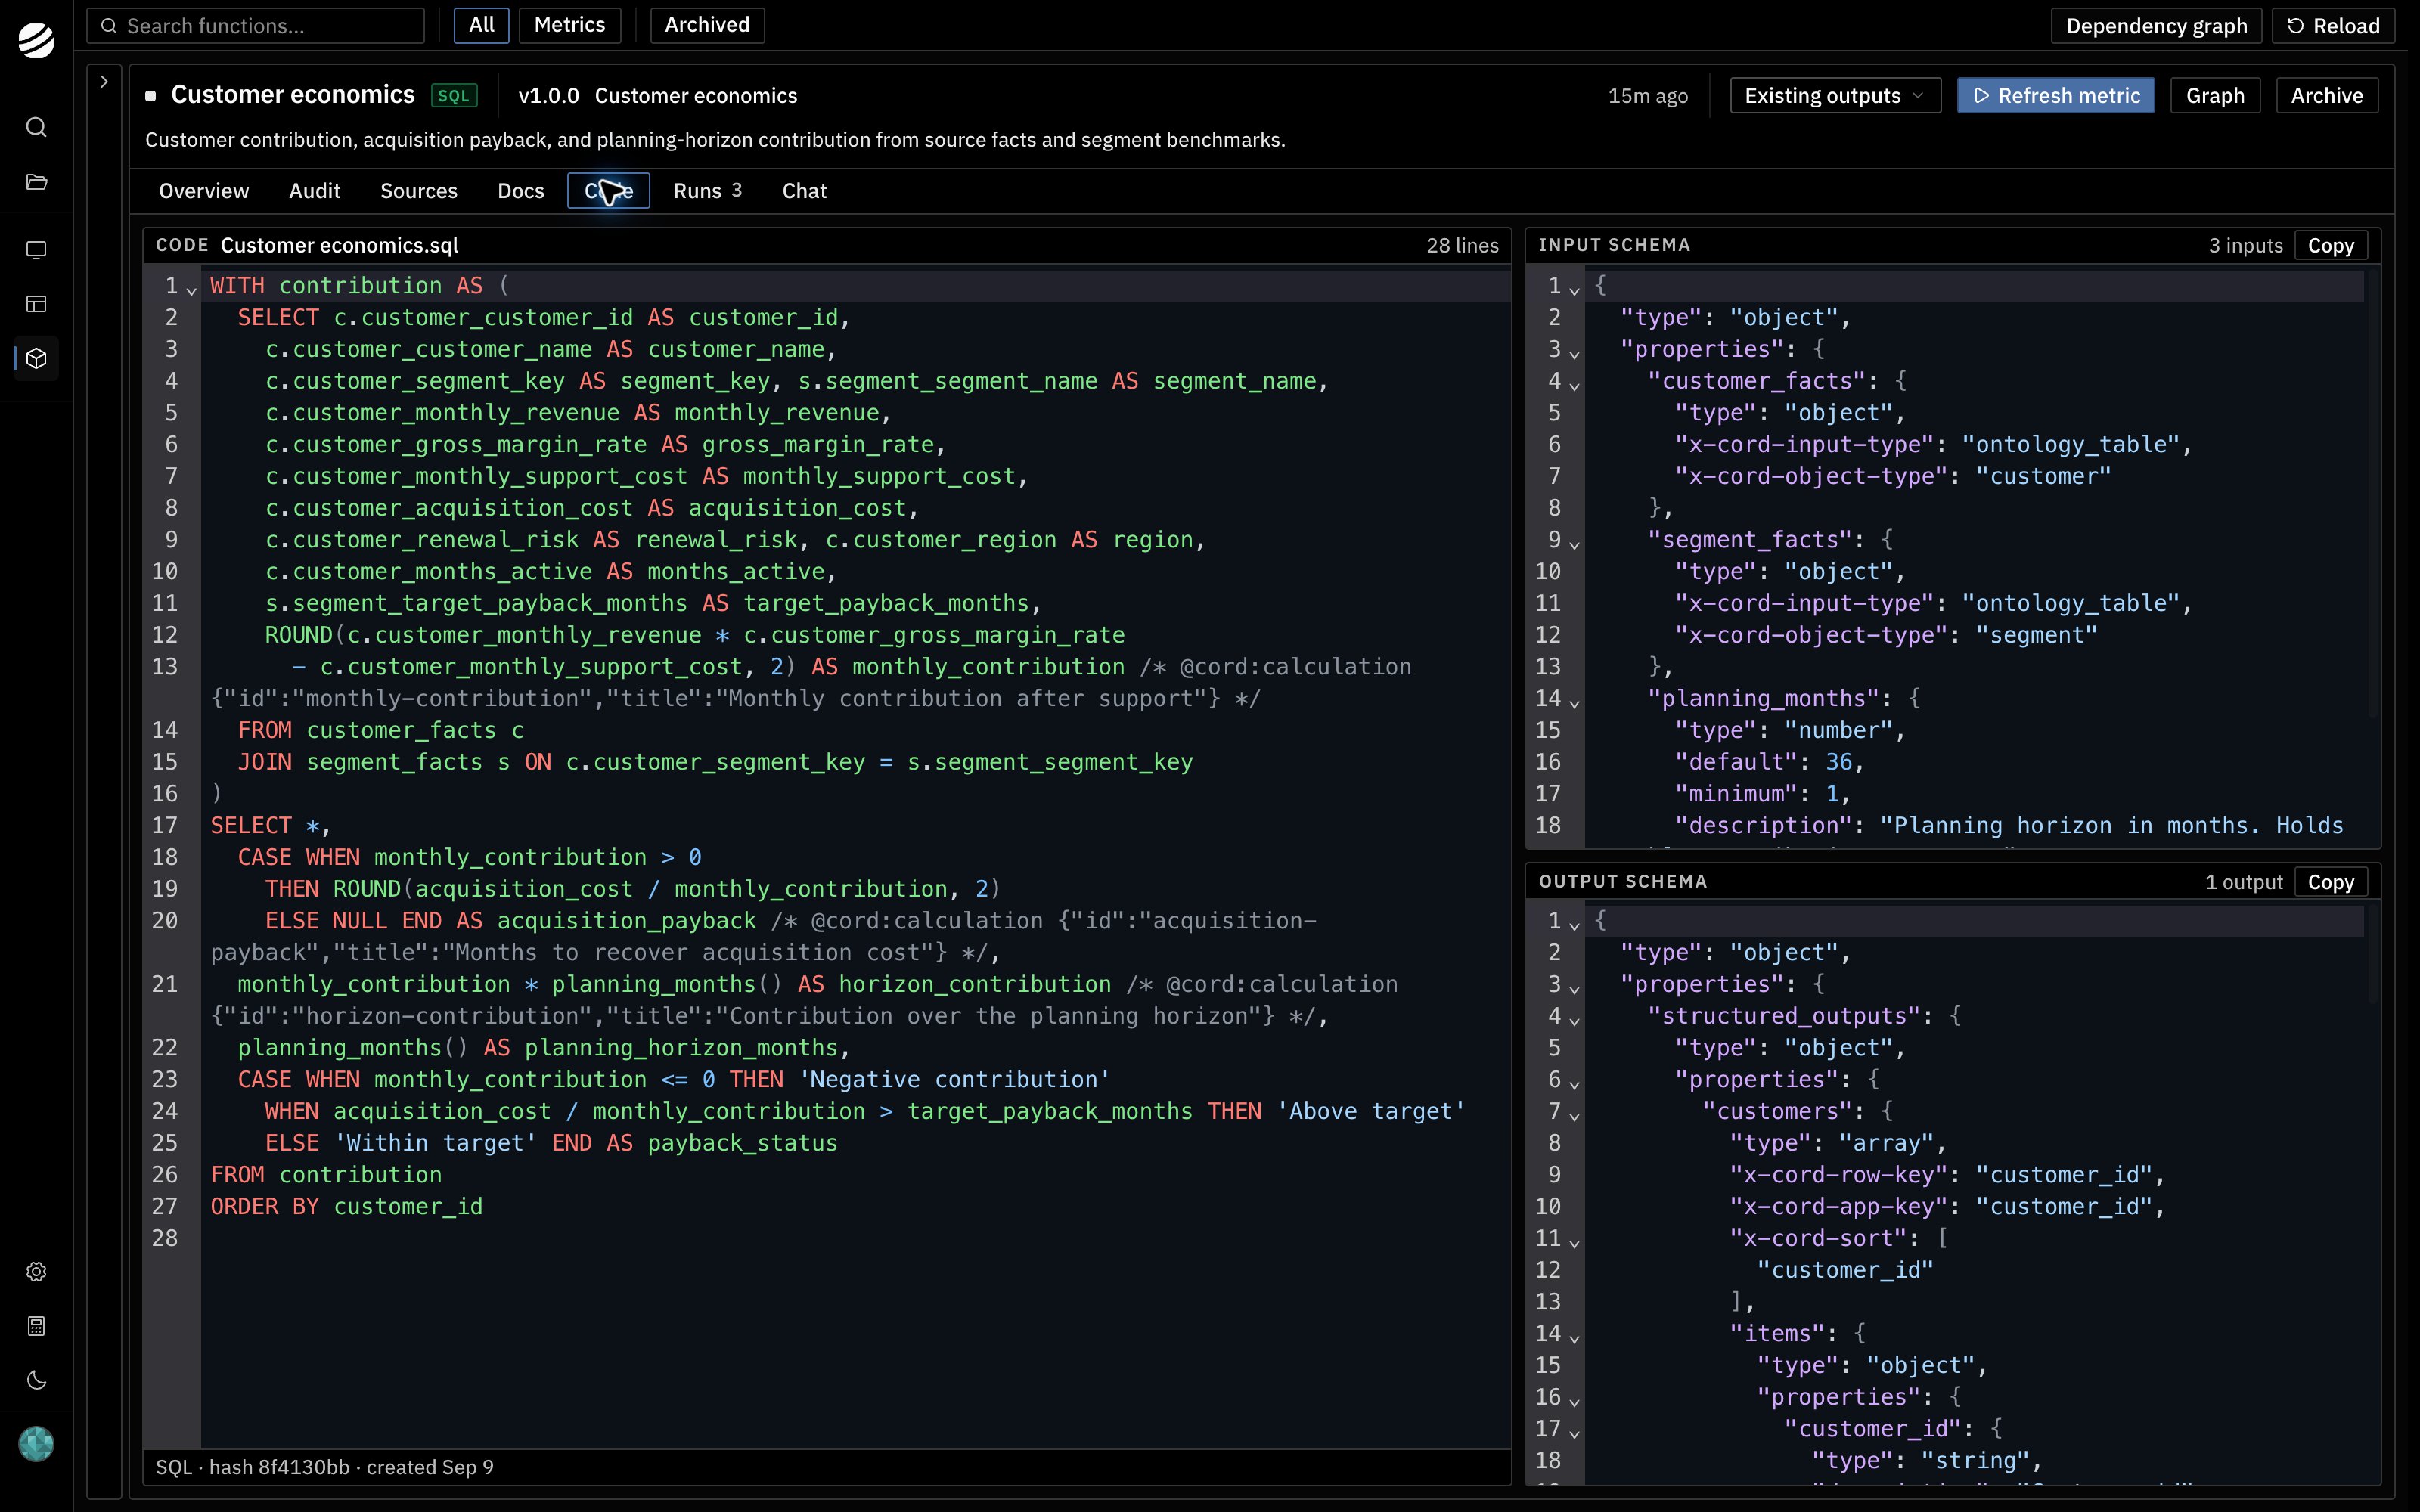
- Customer economics
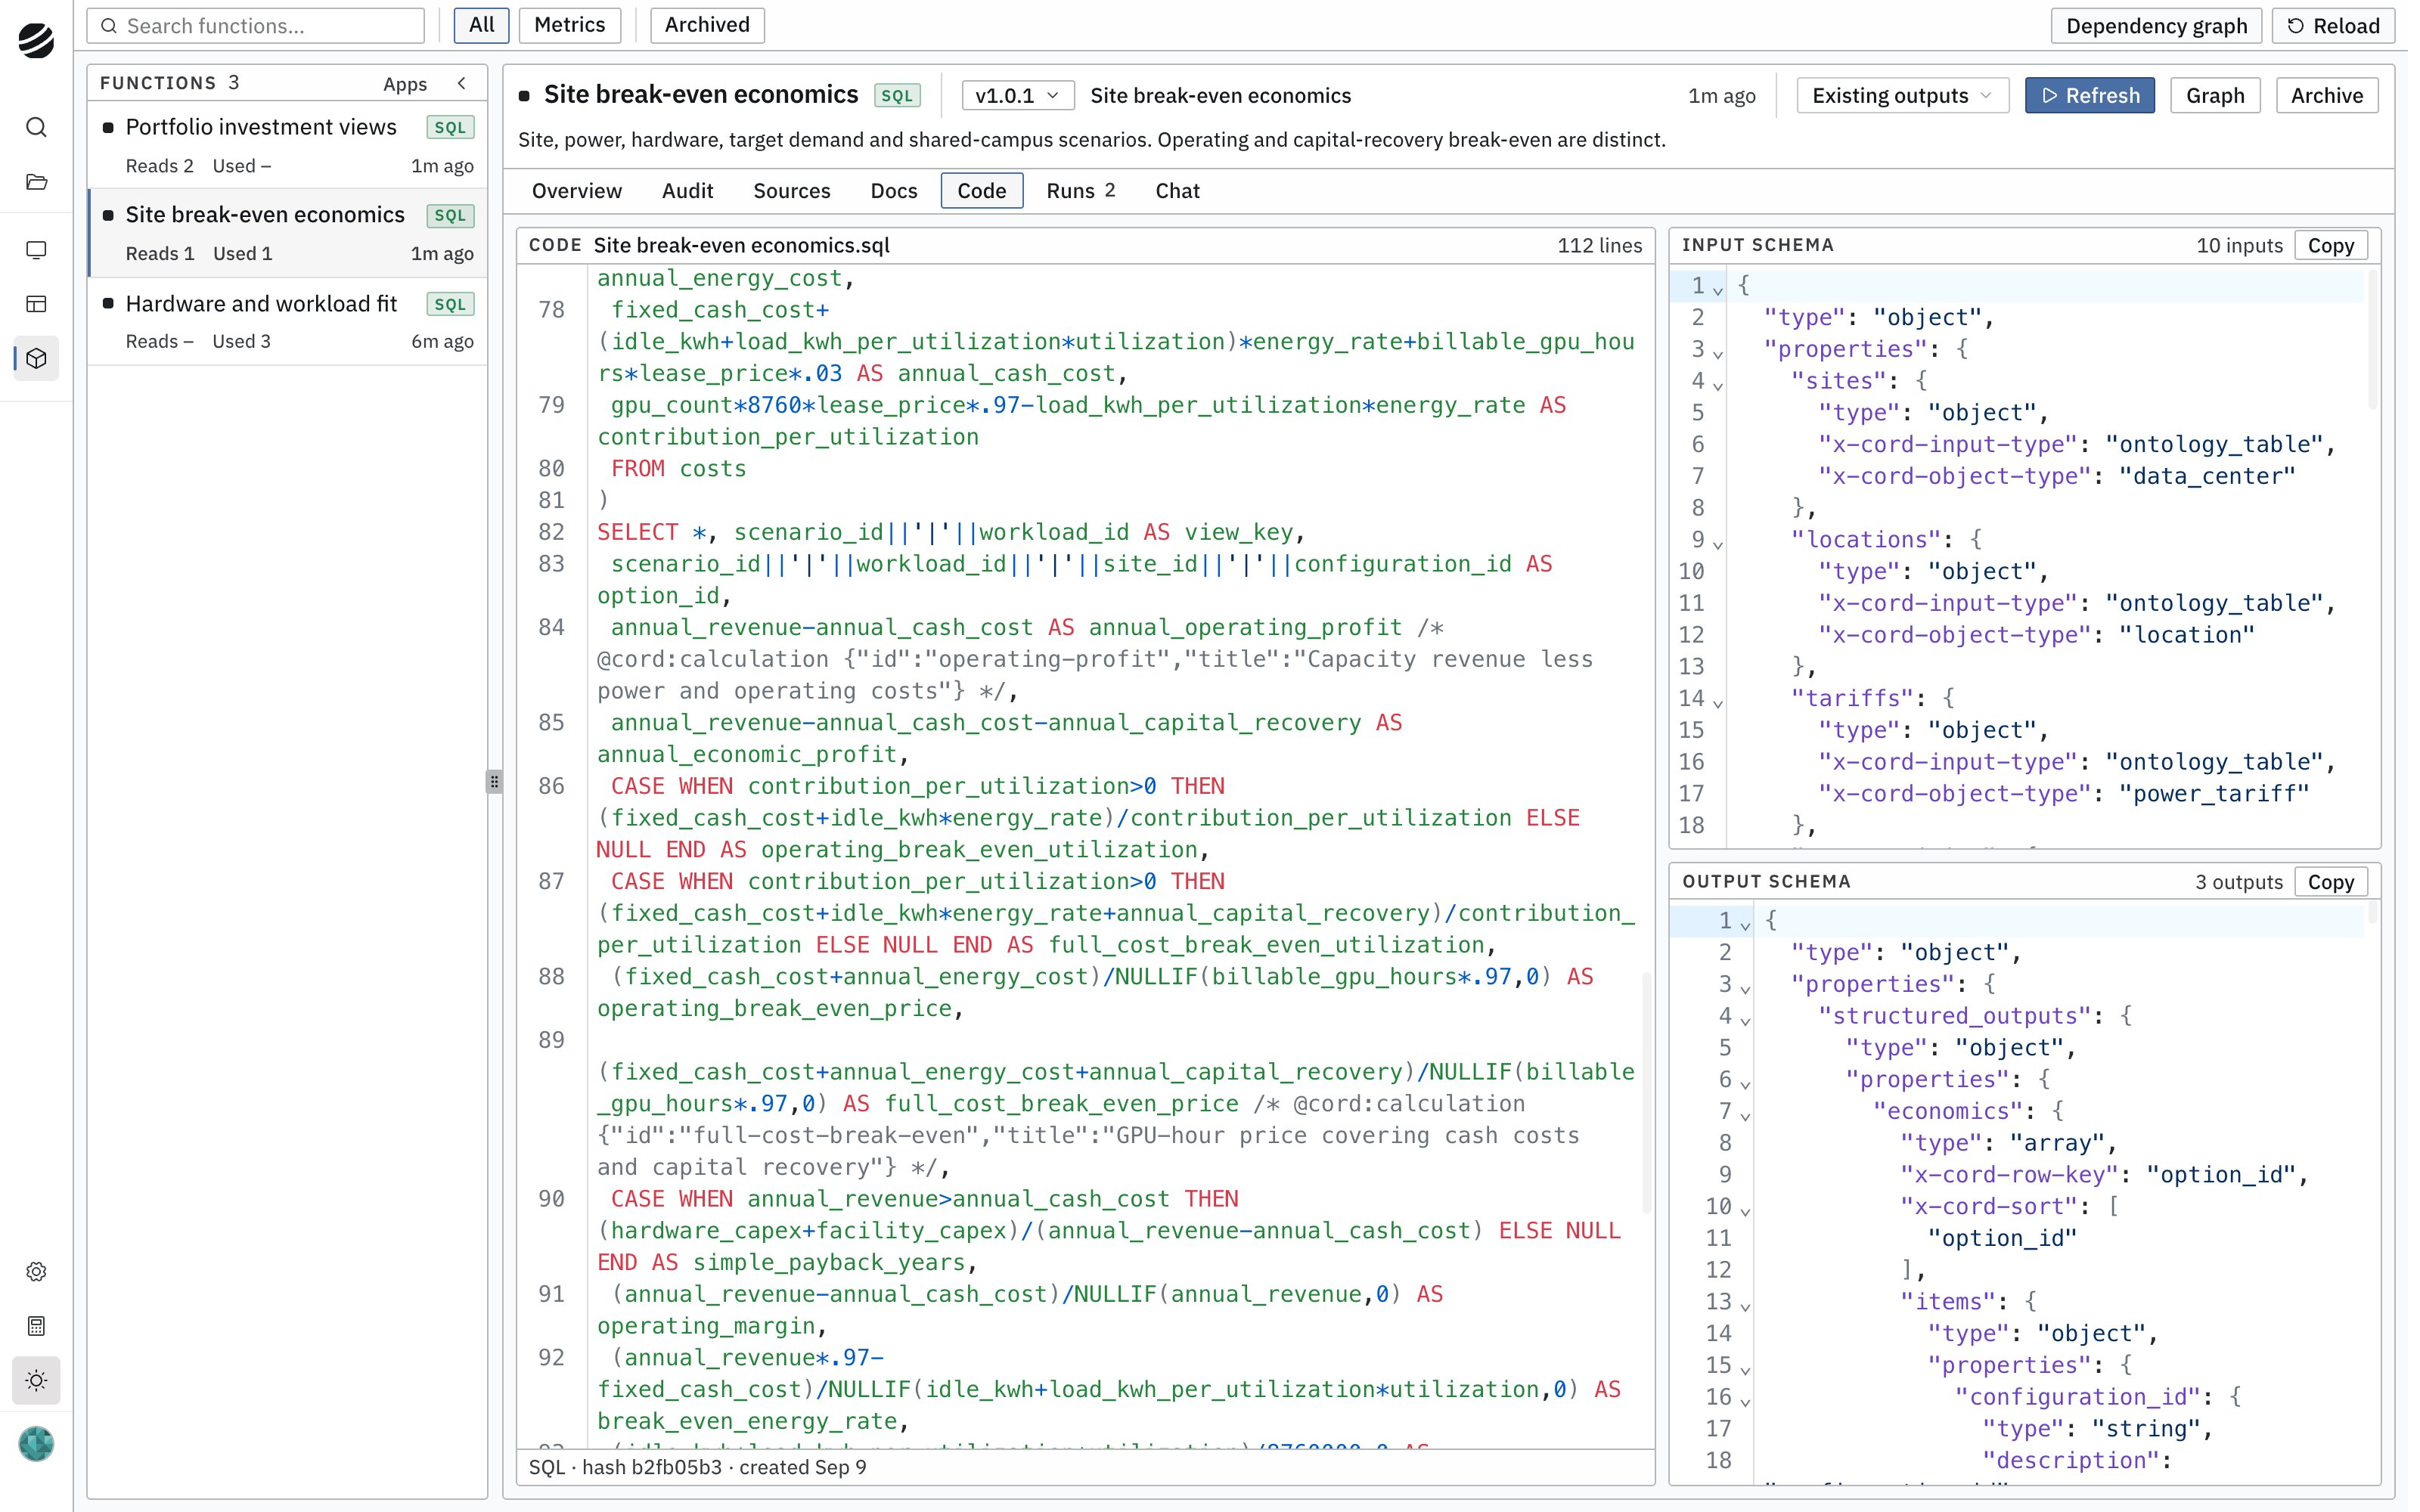
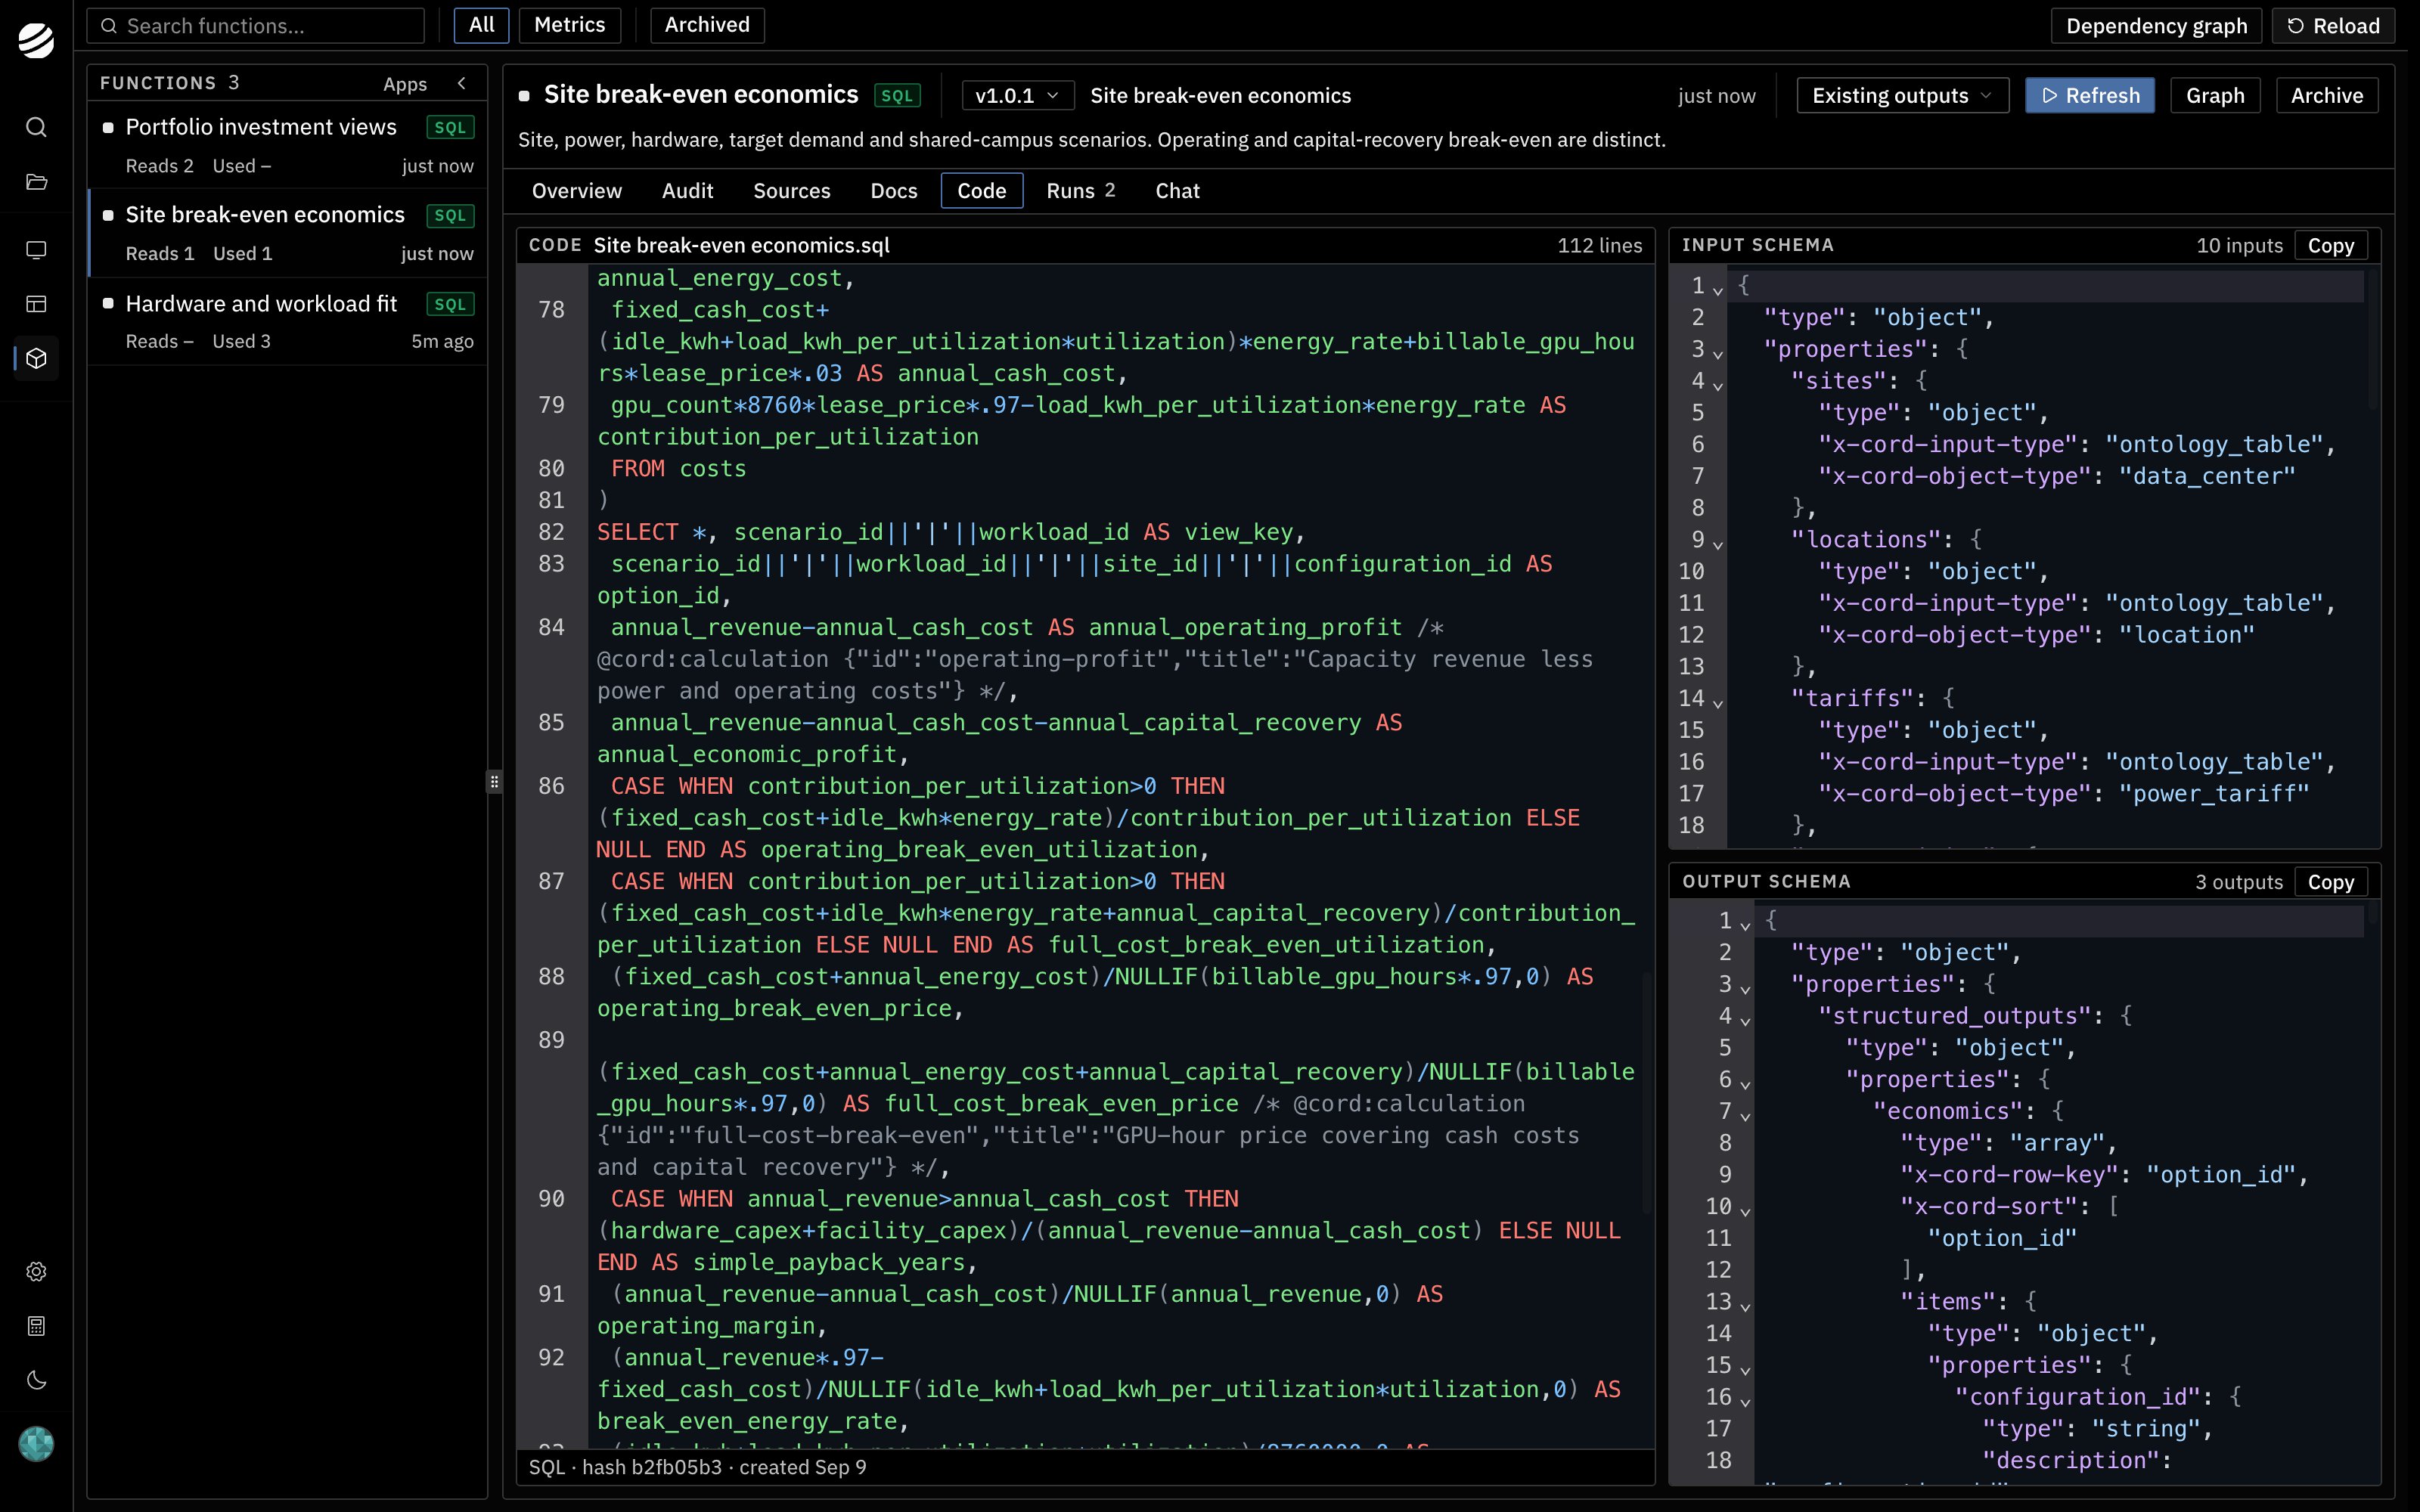
The Code tab. Operating profit, economic profit, and break-even, written by the agent.
Worked examples
The same three parts, definition, data setup, and run, hold for a function of any size. Below are two: one that scores each candidate site for a capital investment, and one that scores each customer. Pick the one closer to your business.- Compute capex
- Customer economics
A site break-even function scores each candidate data center under each planning scenario. From Data Center it reads the site’s GPU count and capex. From Power Tariff it reads the energy rate at the site’s location. From Planning Scenario it reads billable utilization, lease price, and the capital recovery rate . Server cost and power draw come from an upstream function, Hardware and workload fit. It takes two assumptions, an energy factor and a lease factor, both defaulting to 1. It works through six steps, and one of them is conditional.Capital recovery is the annual charge for the hardware over 5 years and the facility over 15, plus the scenario’s return on the capital. The fee is 3% of revenue.For one site and design, Dallas 01 with 30,648 H200 GPUs, under two scenarios:
Three object types, one upstream function, and two assumptions take part. The scenario is an object, so one run scores every site under every scenario, and the app’s scenario buttons switch between rows of the same output. A second function, Portfolio investment views, rolls the sites up into plan totals. The app shows the site comparison from the first and the KPI tiles from the second.
Assumptions and scenarios
A rule is a condition in the logic: a case per segment, a filter, a flag column. The threshold behind it is an assumption on the data setup, a single value such as a planning horizon, a capital recovery rate, or a payback limit, so it can be changed without touching the code. Changing an assumption marks the function stale. Rerunning it recomputes the result, and the functions that depend on it can be rerun in order after it. A scenario is a second data setup with different assumptions. Both runs are kept, so the base case and the scenario can be compared side by side.One definition, many apps
Functions build on each other. A site economics function can feed a portfolio view, a plan builder, and a deal model, and each of those can feed further functions. Because the definition lives in one place, the investment committee, the site team, and corporate development are looking at the same number, and a change to the definition reaches all of them through the same versioning.Agents use functions too
A function is deterministic code. The same inputs produce the same output every time, and the logic can be read and audited. When an agent in Cord needs a number, it runs the function and cites the result rather than working the calculation out itself. That is what lets an agent answer a question about payback or return on capital with a number that is reproducible and traceable, the same way an app would show it.Tracing a number
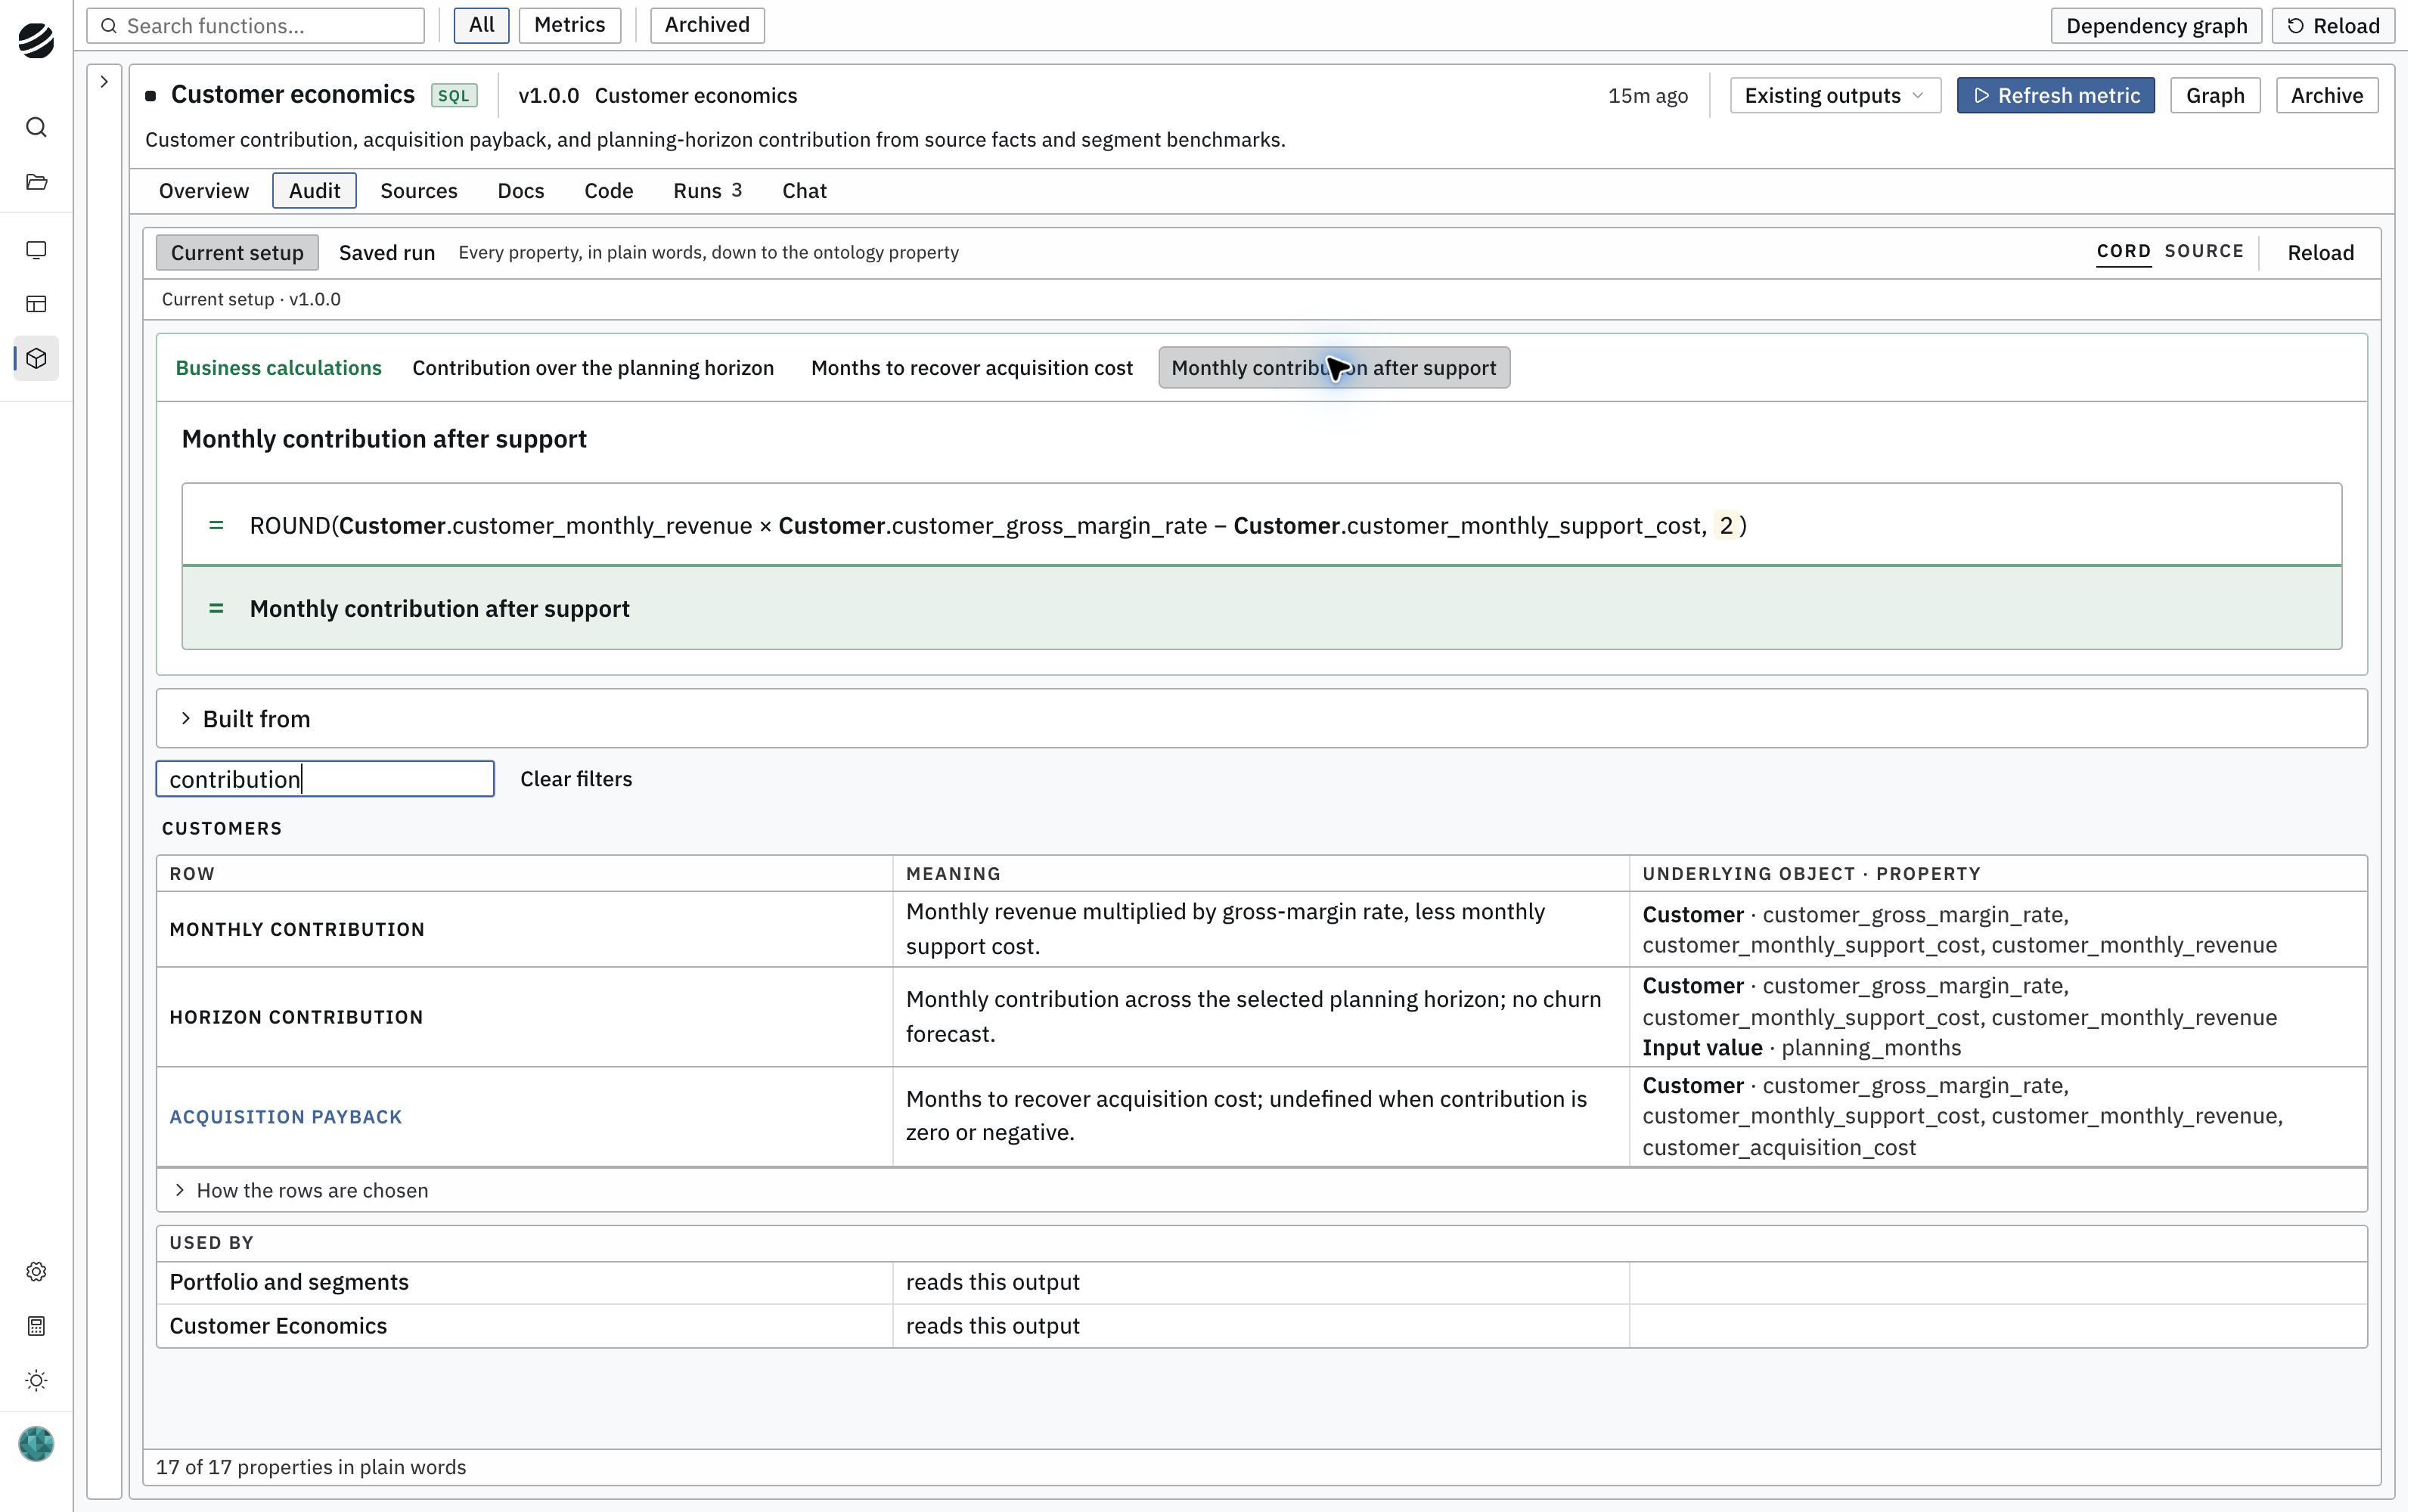
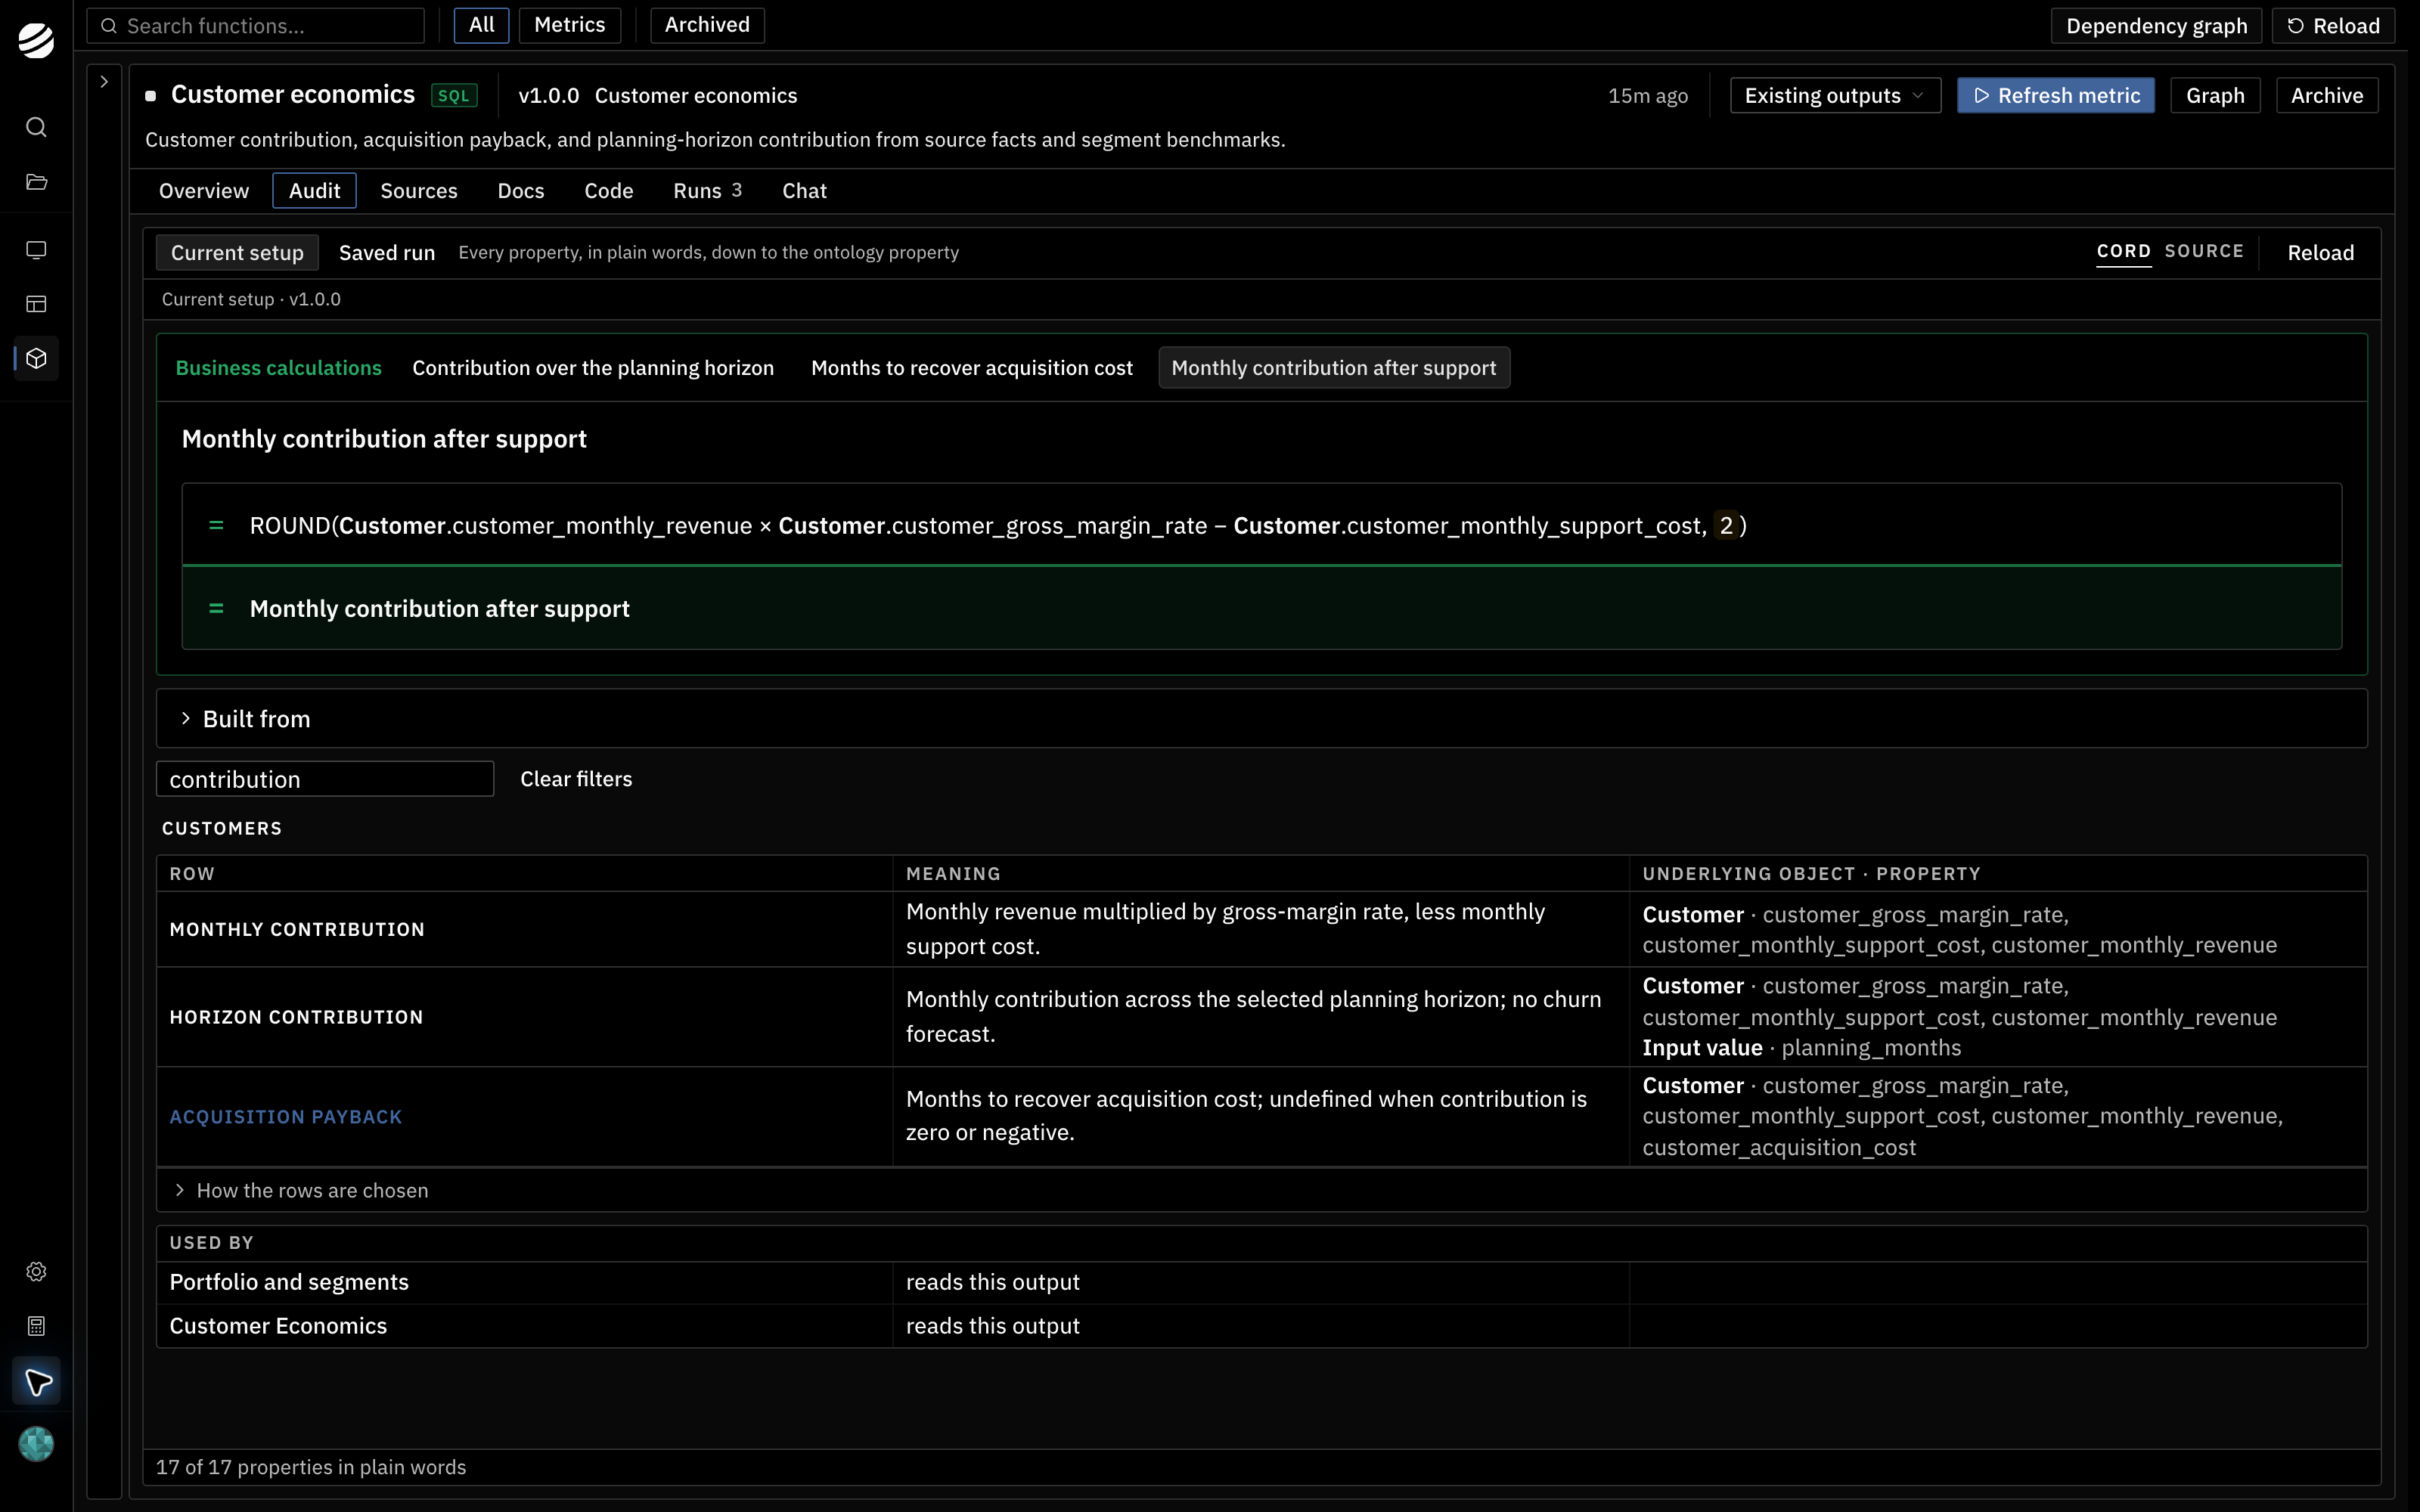
Every output of a function can be followed back to what produced it. The Audit tab describes each output in plain words, shows the formula with the business objects and fields it reads, and for aggregates shows the rows that contributed.- Compute capex
- Customer economics
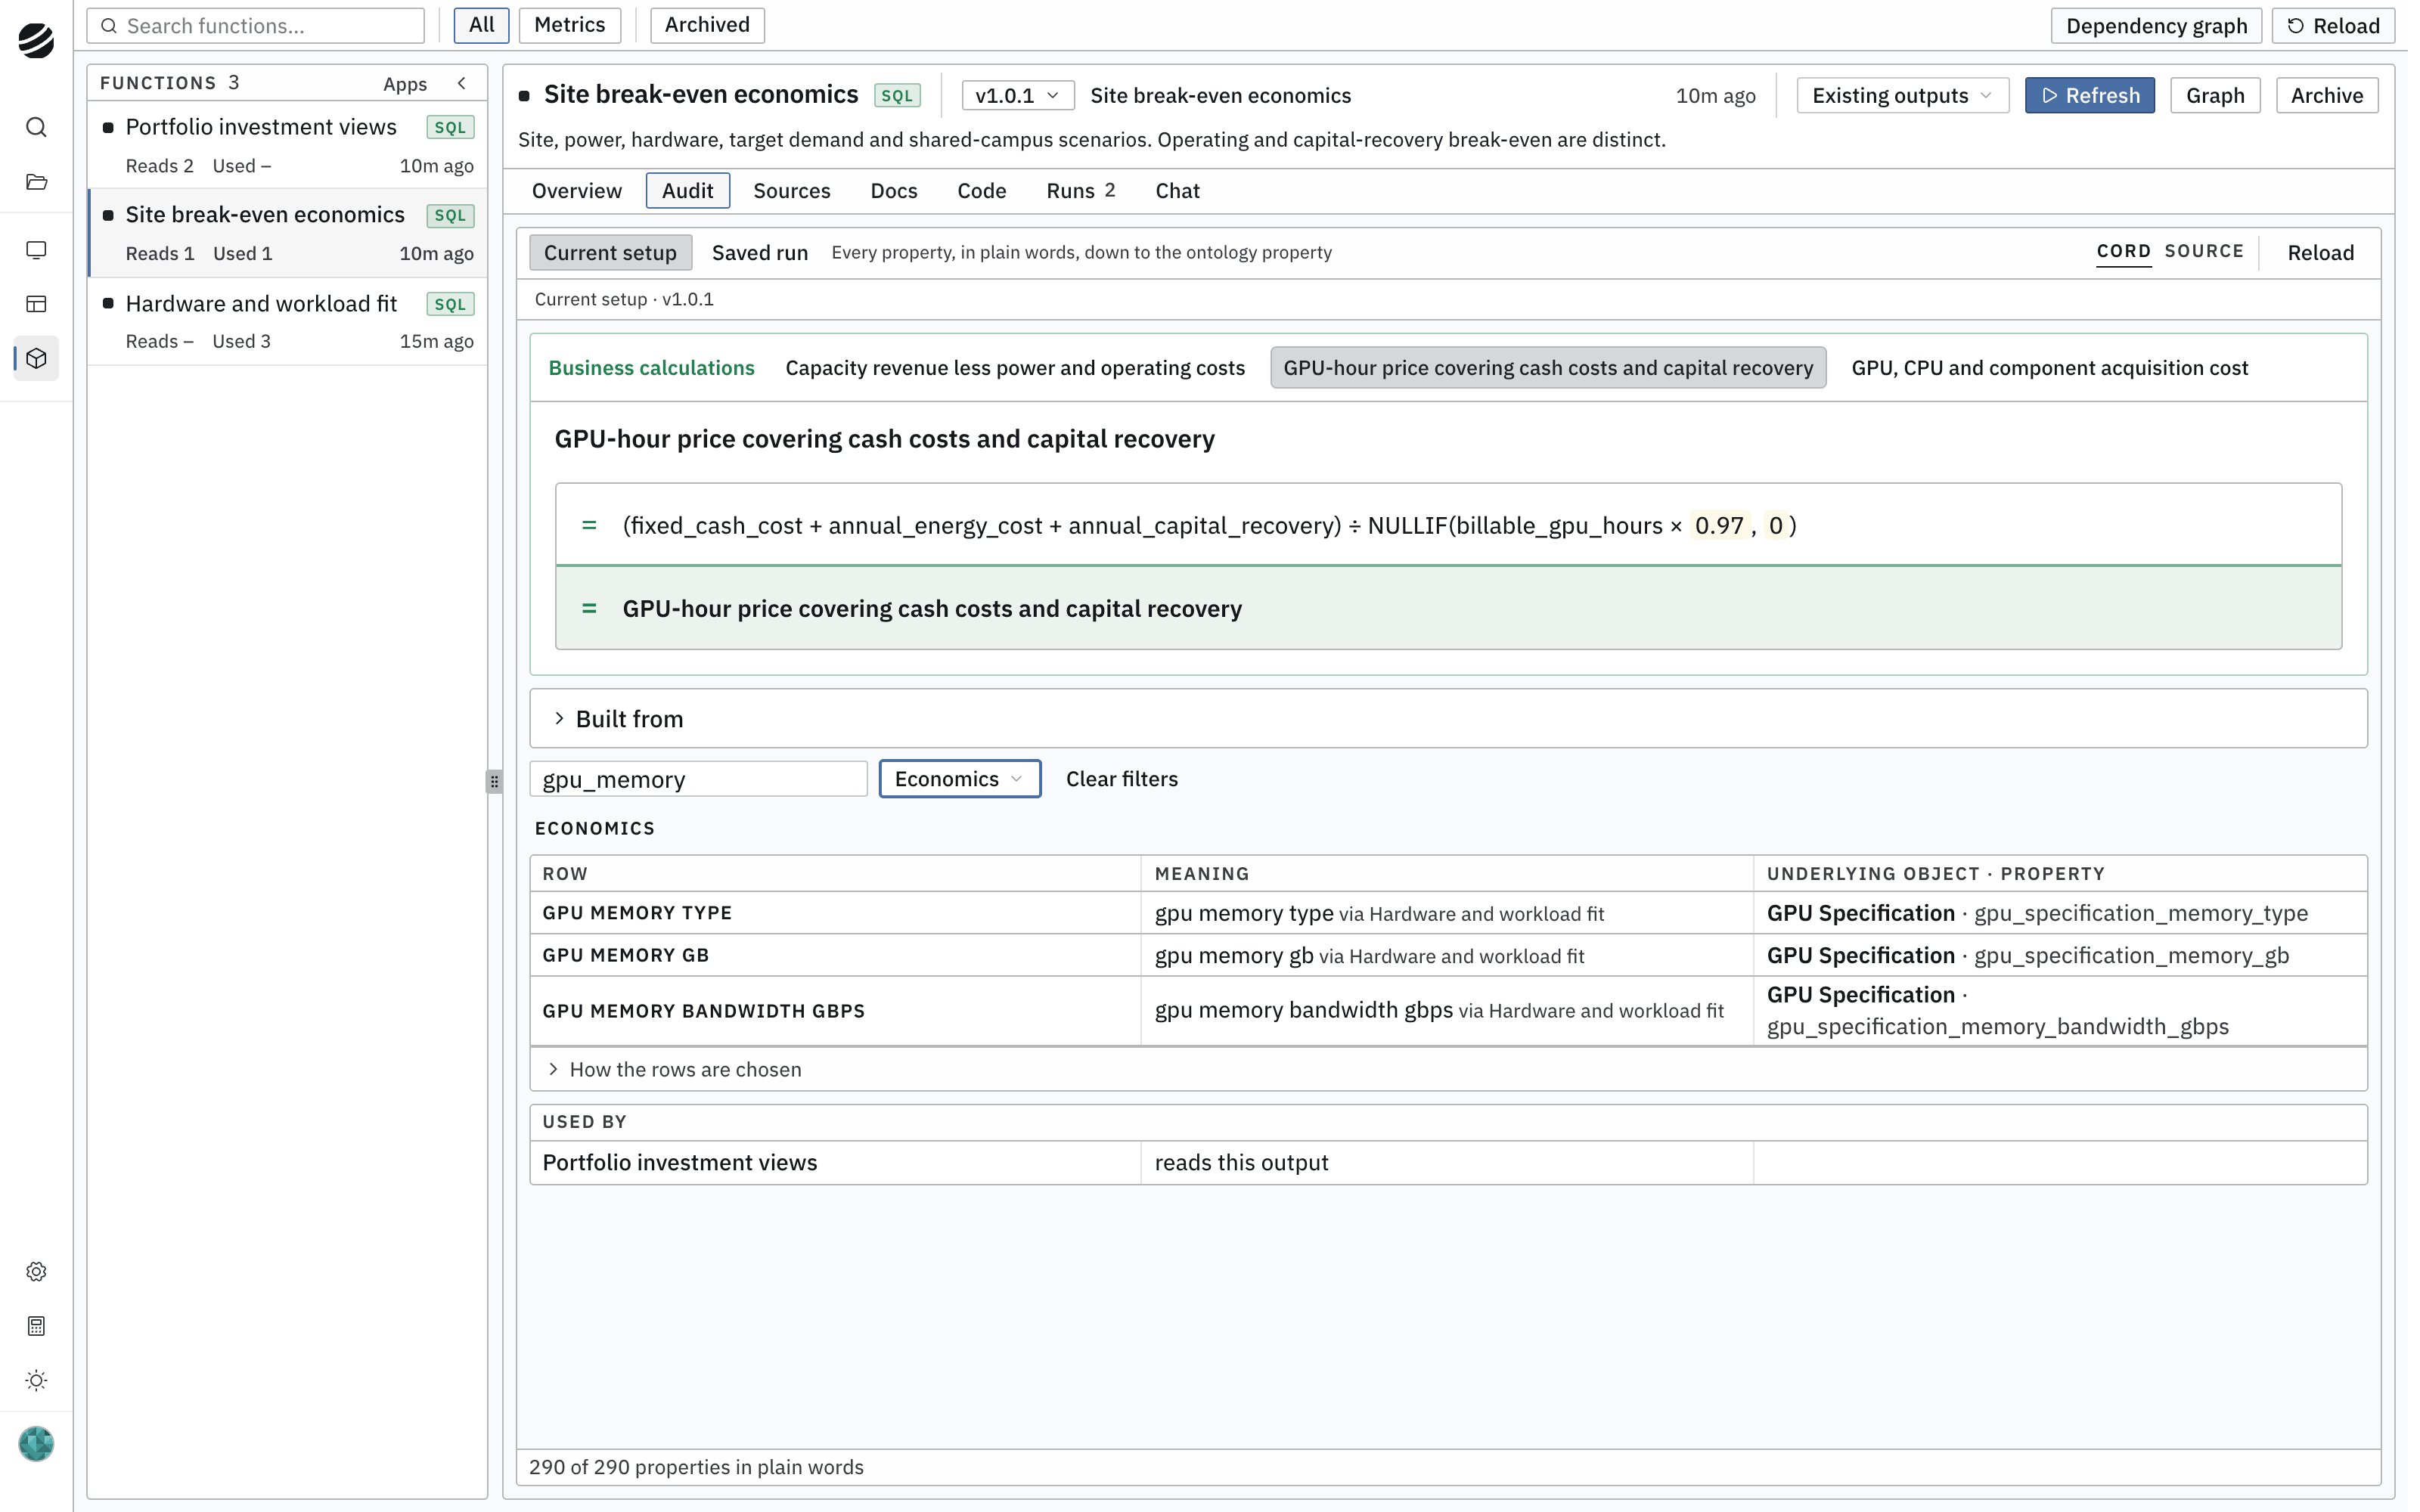
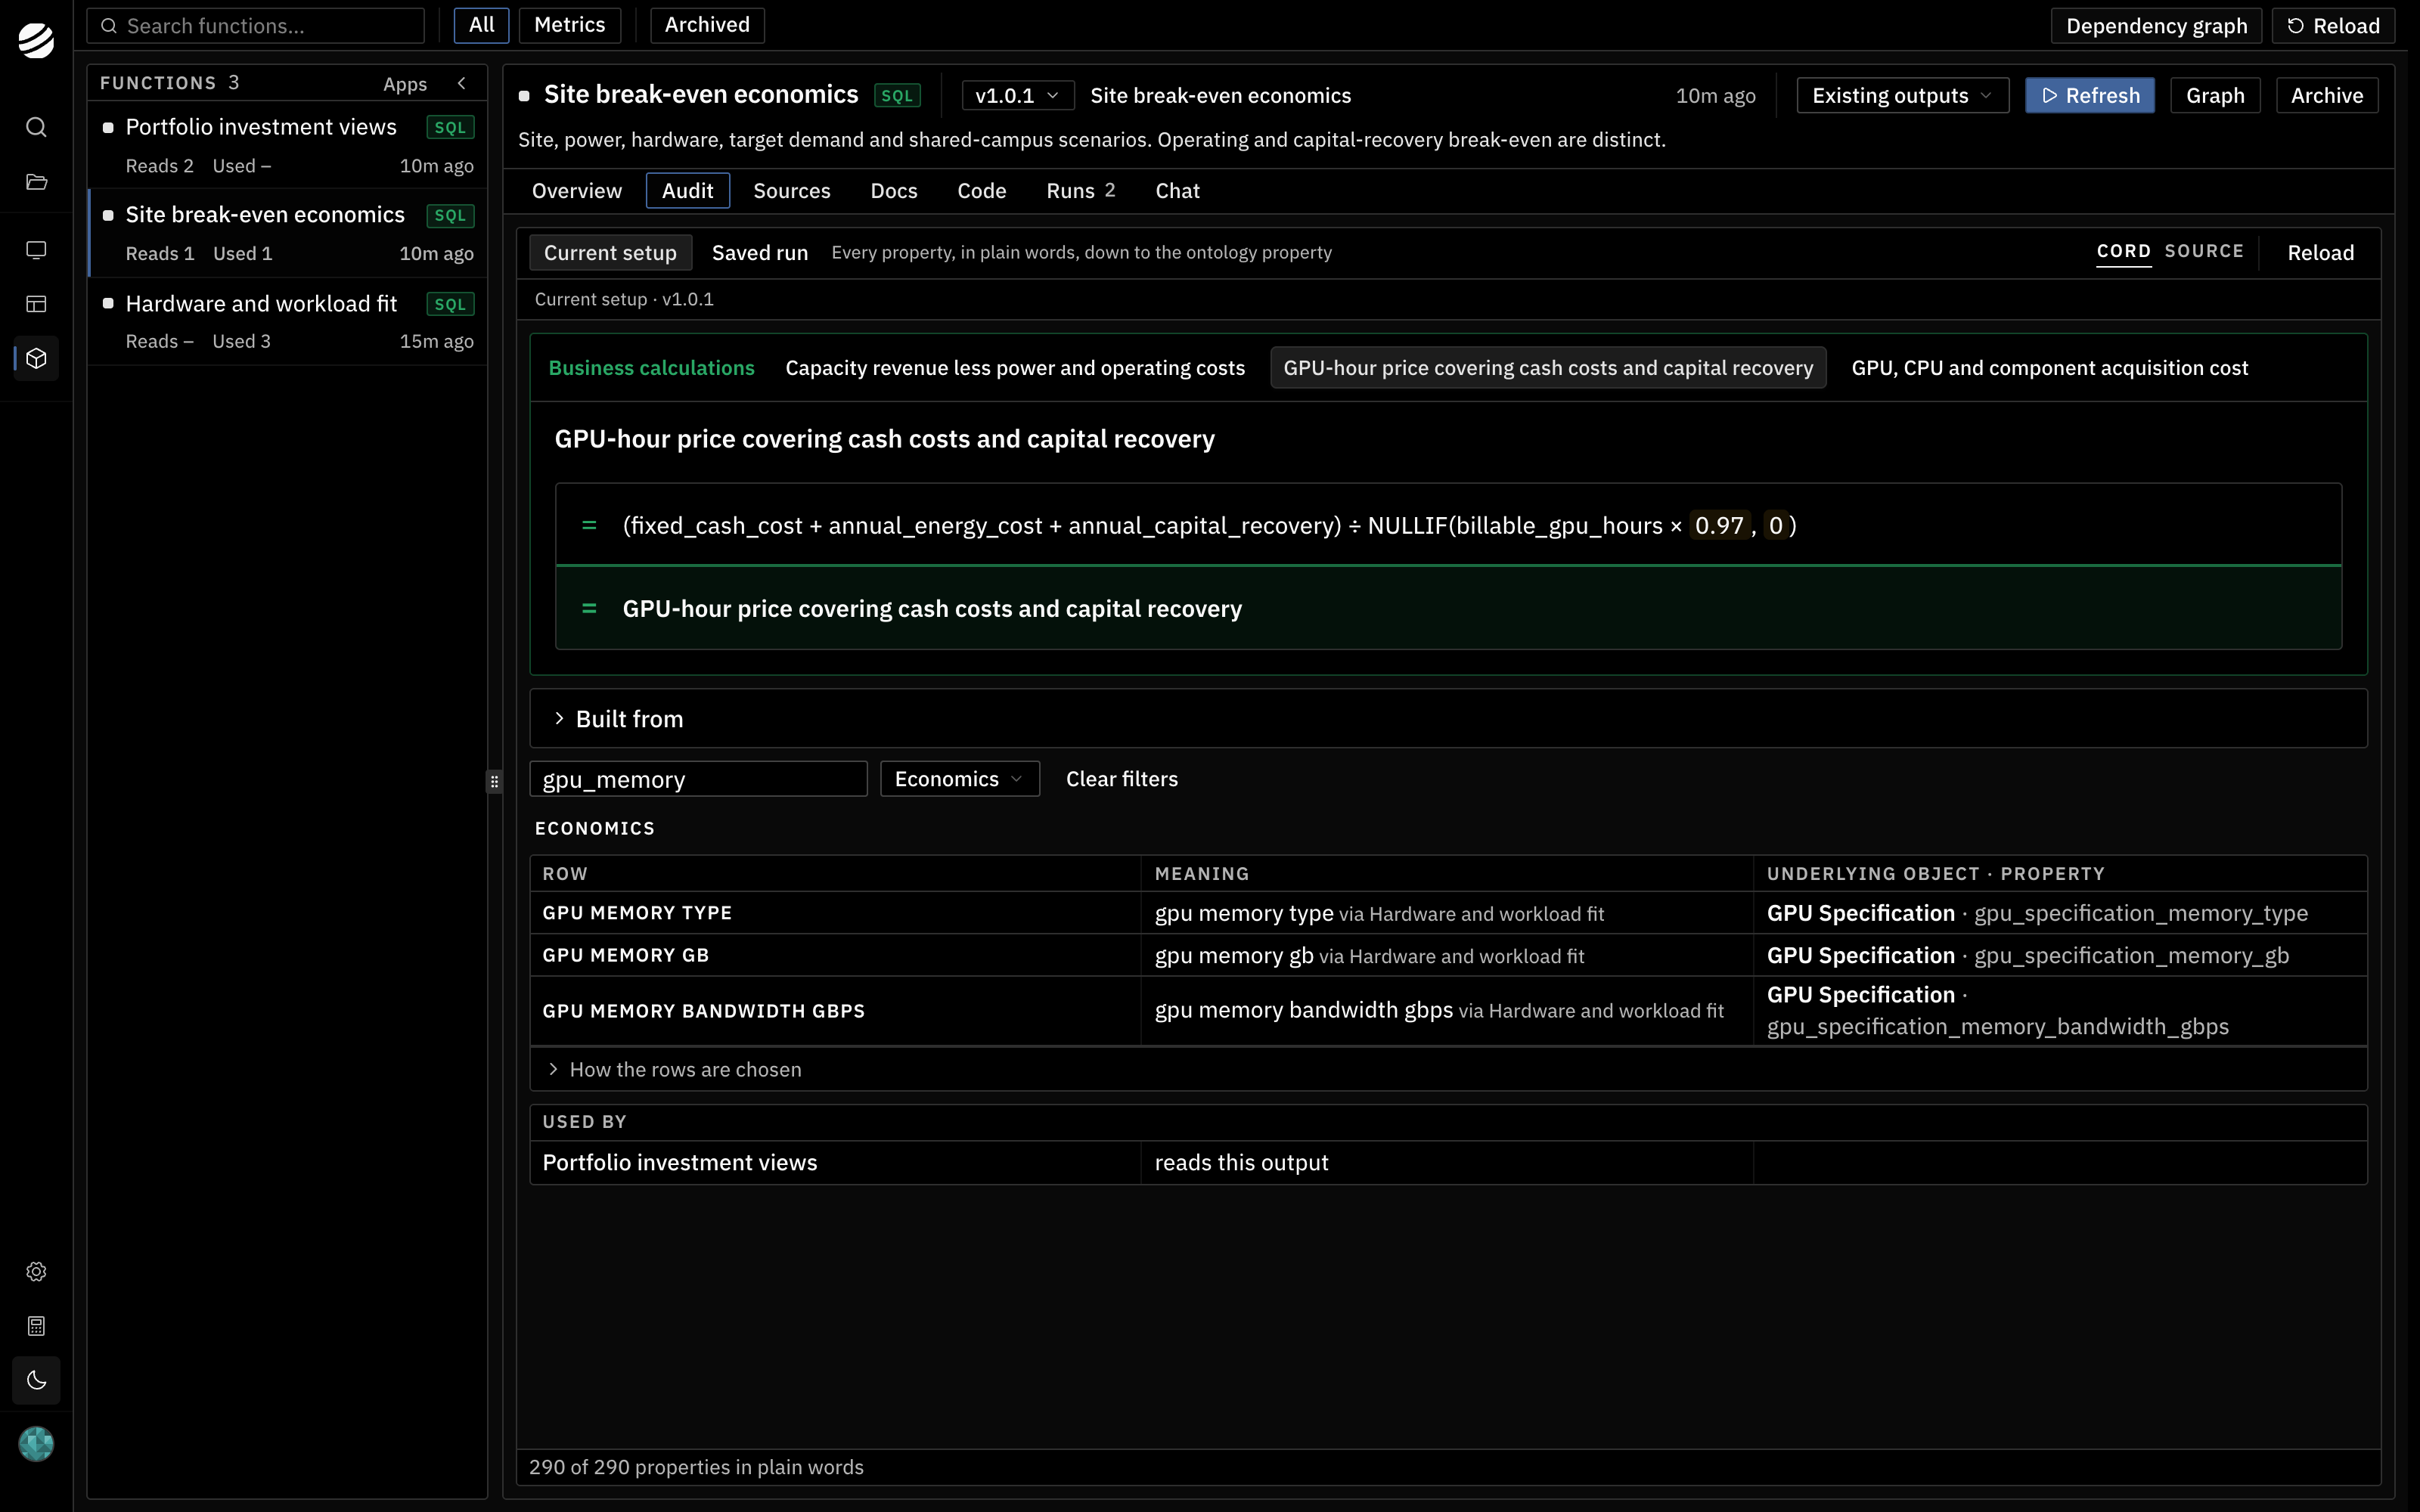
The Audit tab: a break-even price in plain words, traced through a second function to the GPU specification.