An app in Cord is a full-stack software application built on your business logic and data. Building a powerful, delightful app is the ultimate goal in Cord. Even better if you build dozens.Cord apps are custom built around your company’s needs. When those apps help your team make better decisions and get things done, the company benefits.Apps are built entirely by agents. They are powered by functions, can run on live data, and connect to traditional and non-traditional systems of record. Cord apps represent the next era of how software is built, deployed, and maintained in an AI-native world.The examples below show dramatically different use cases at different companies, each built on the same foundations in Cord.
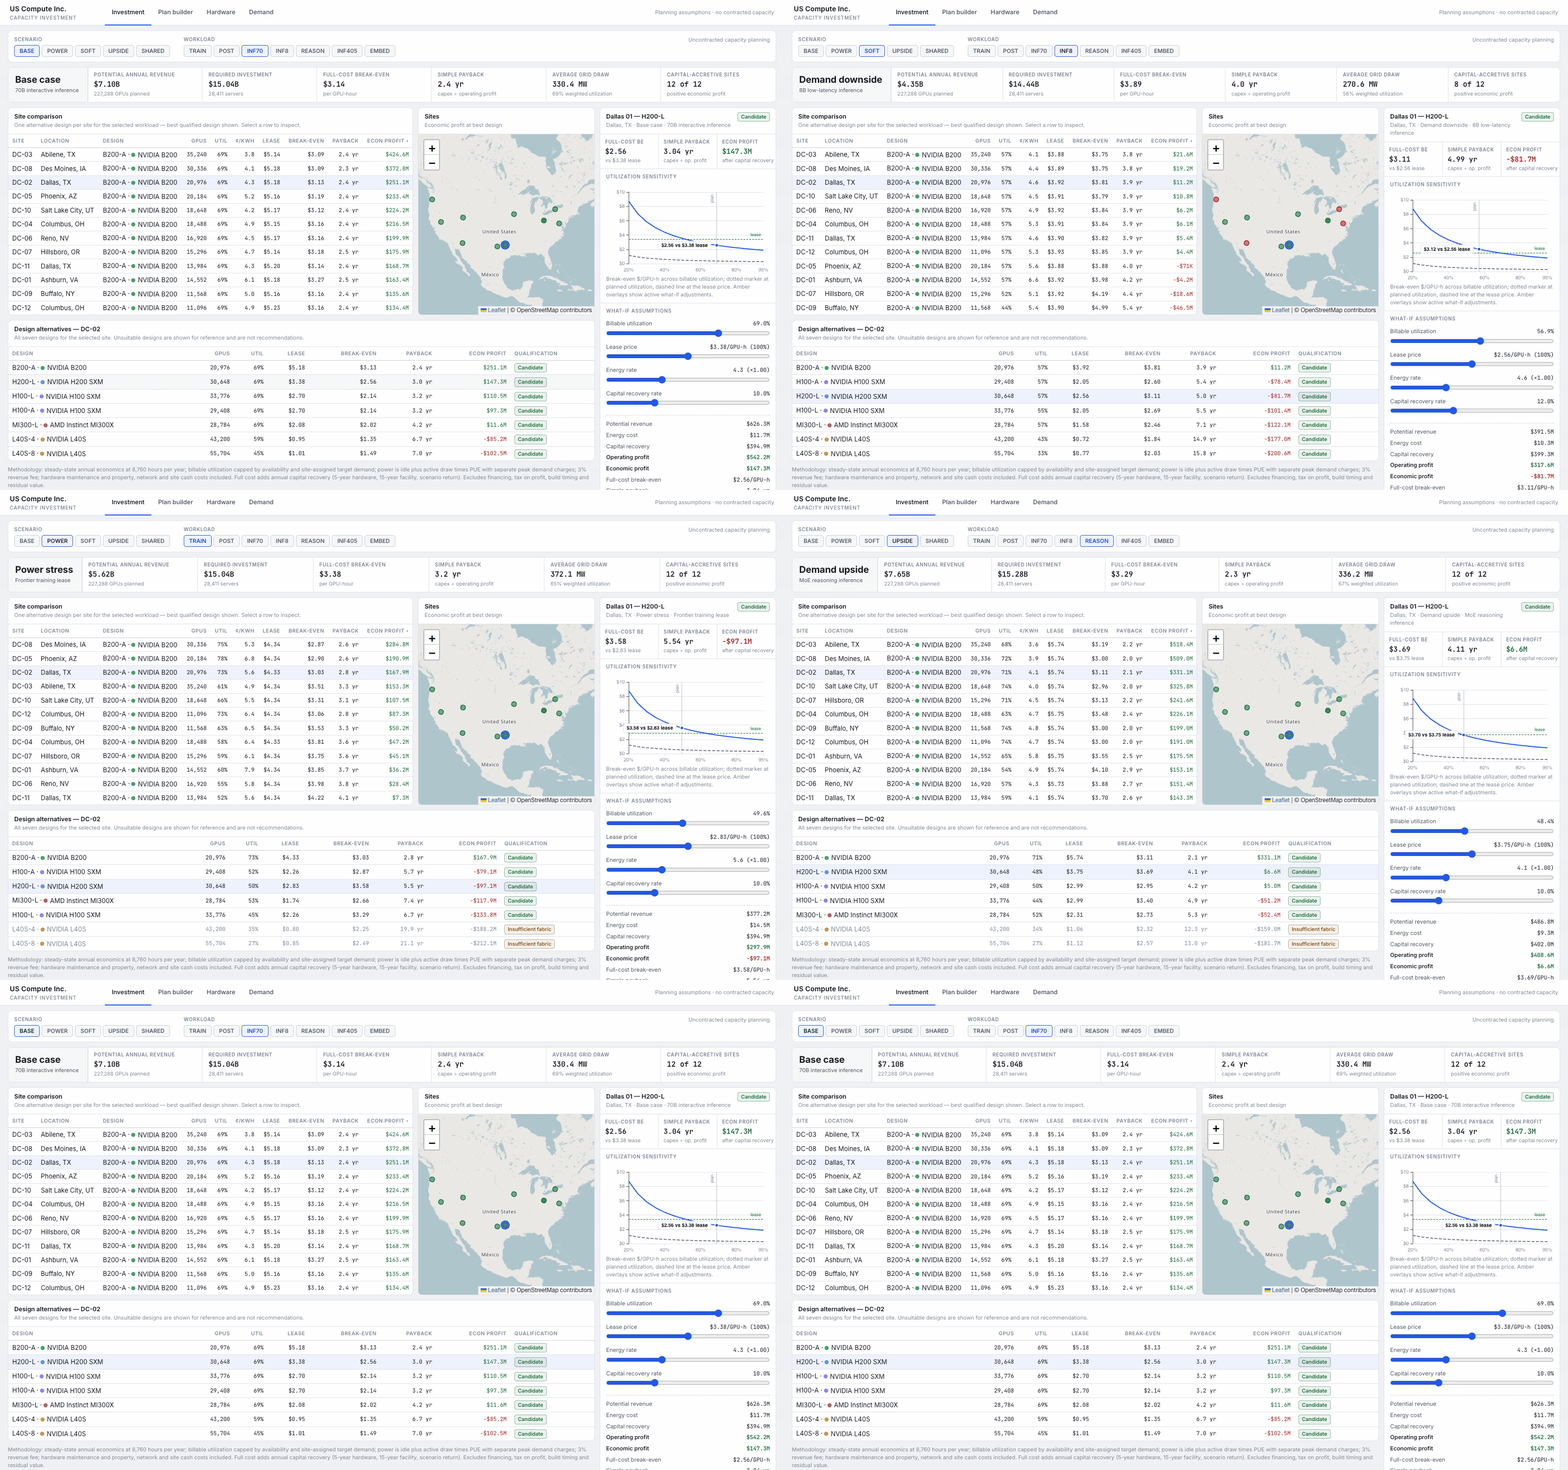
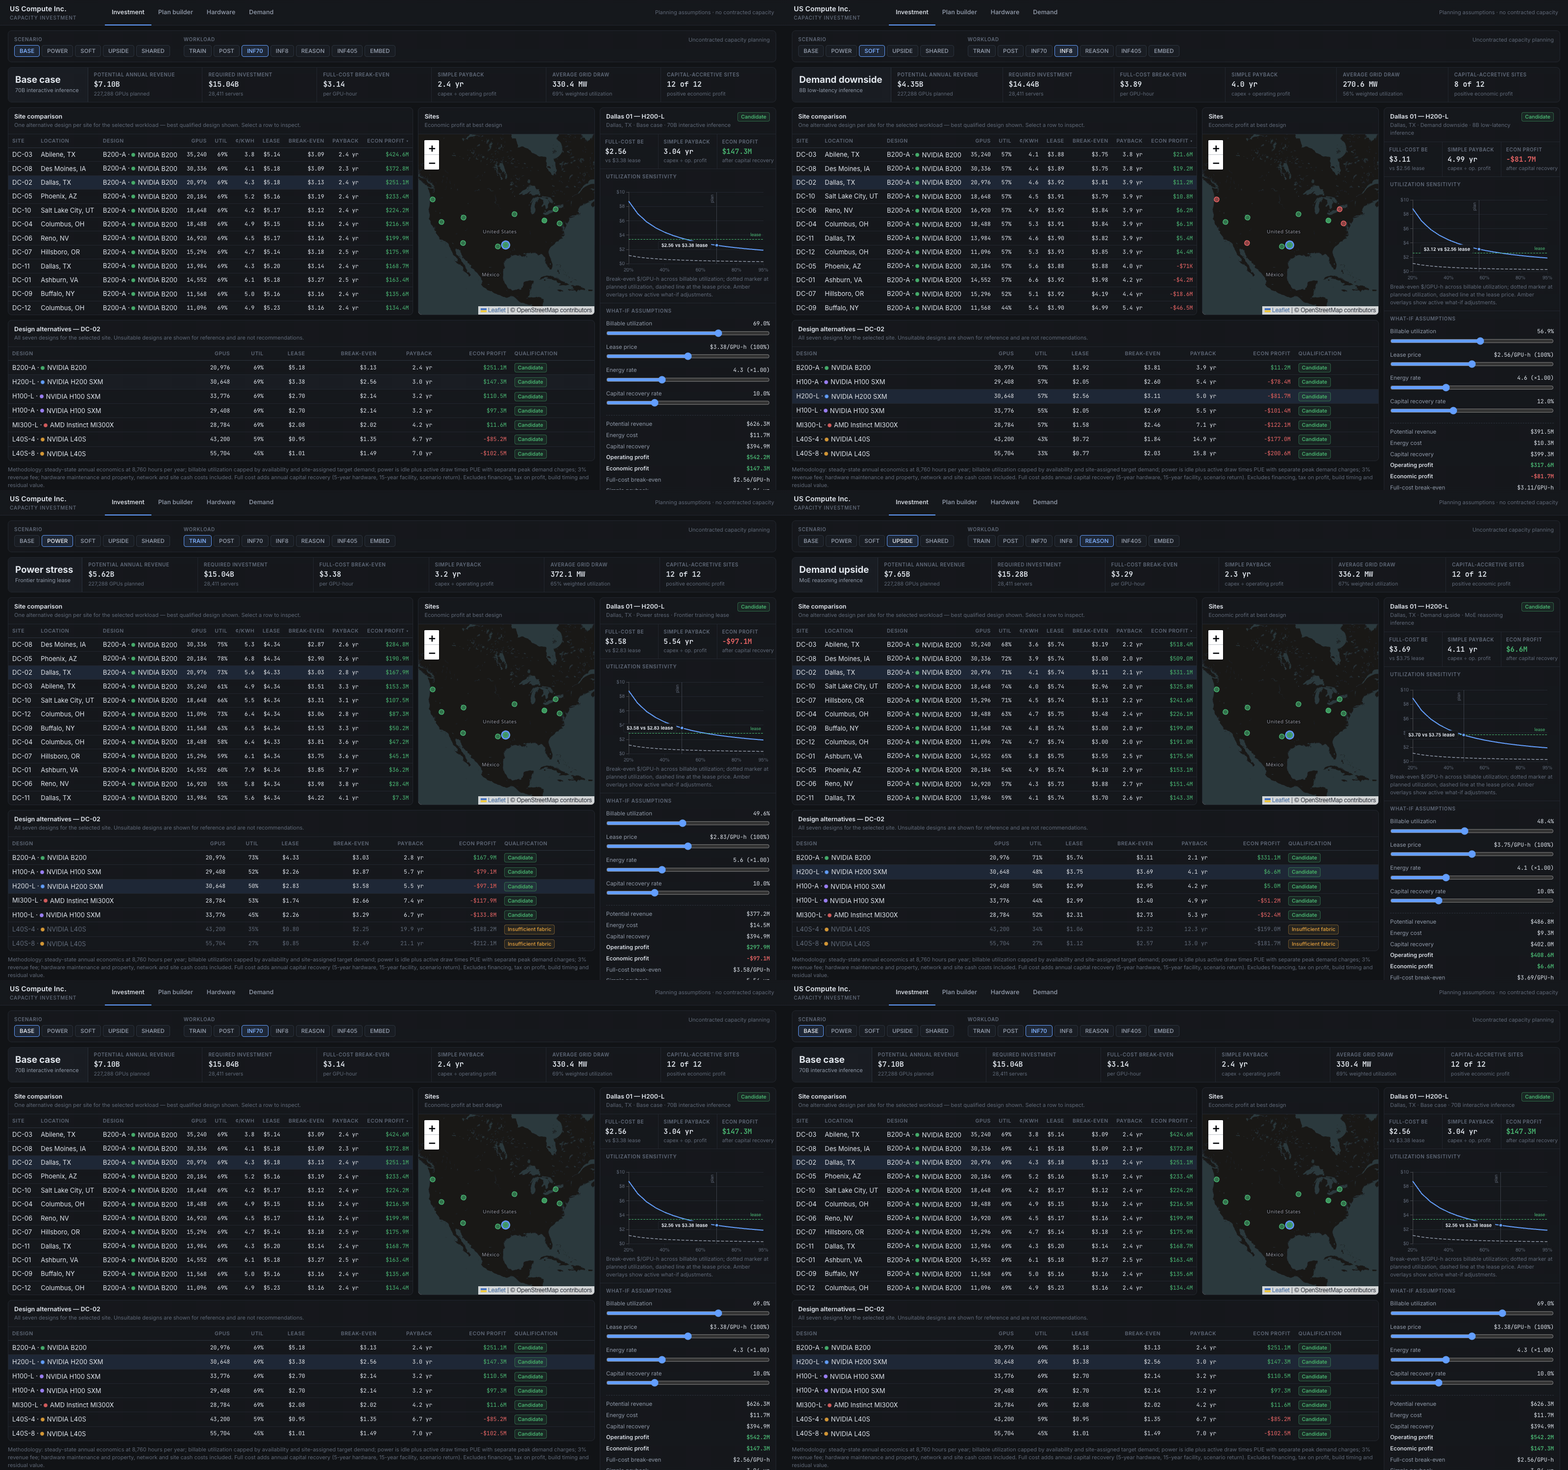
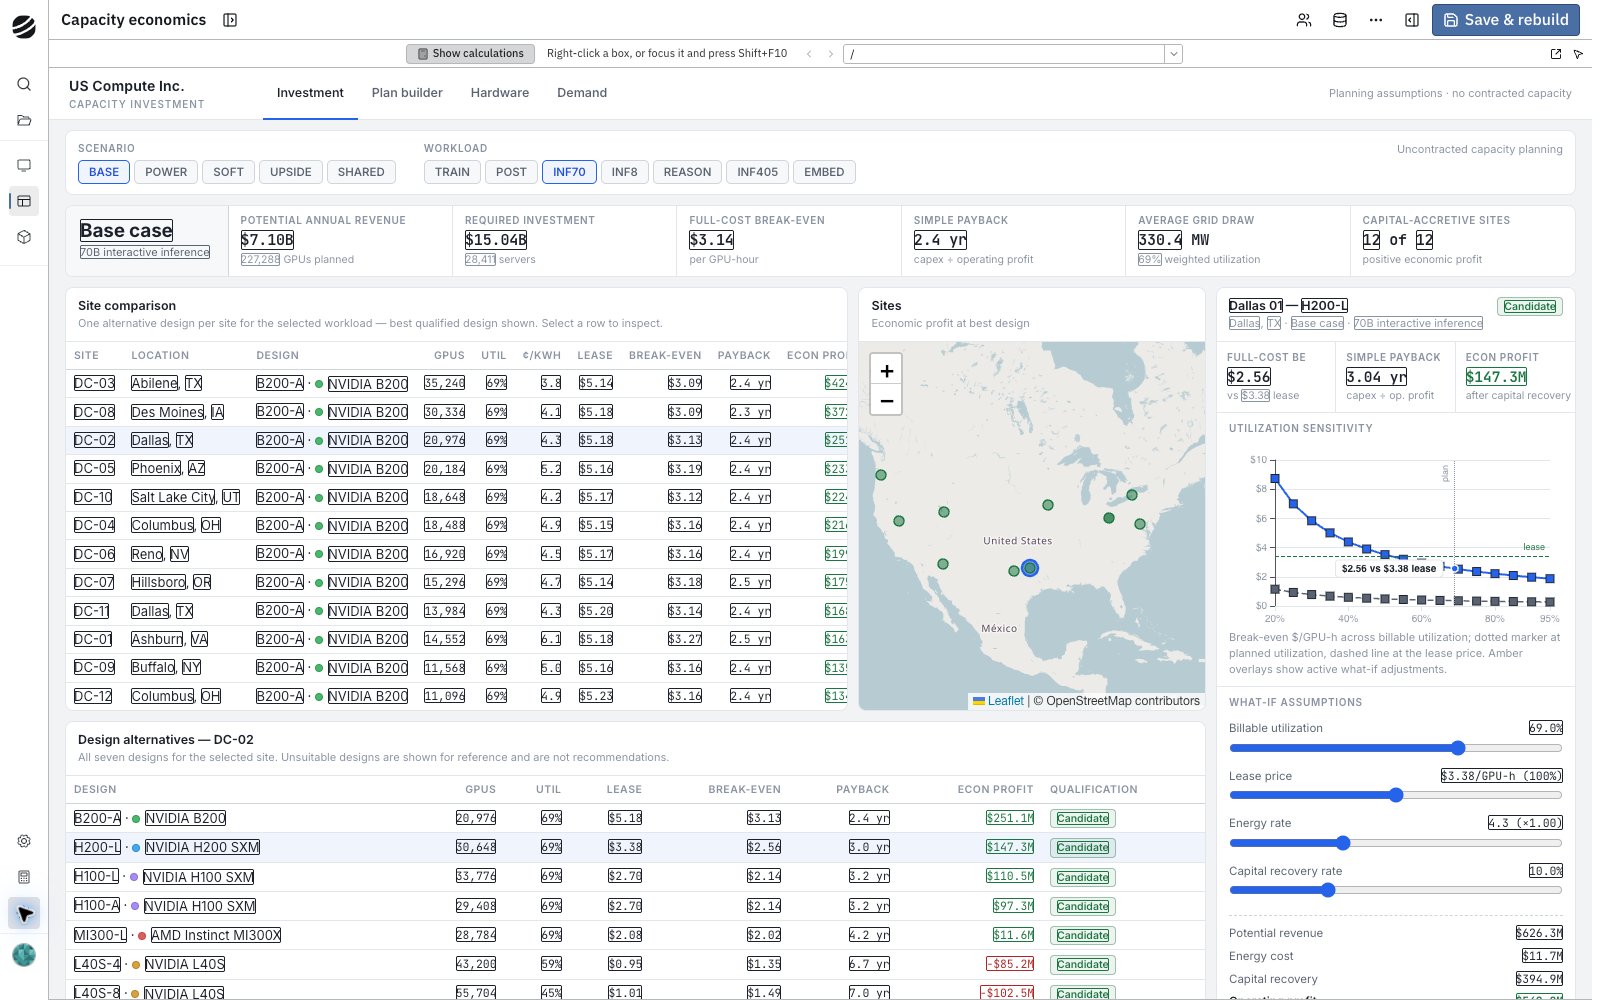
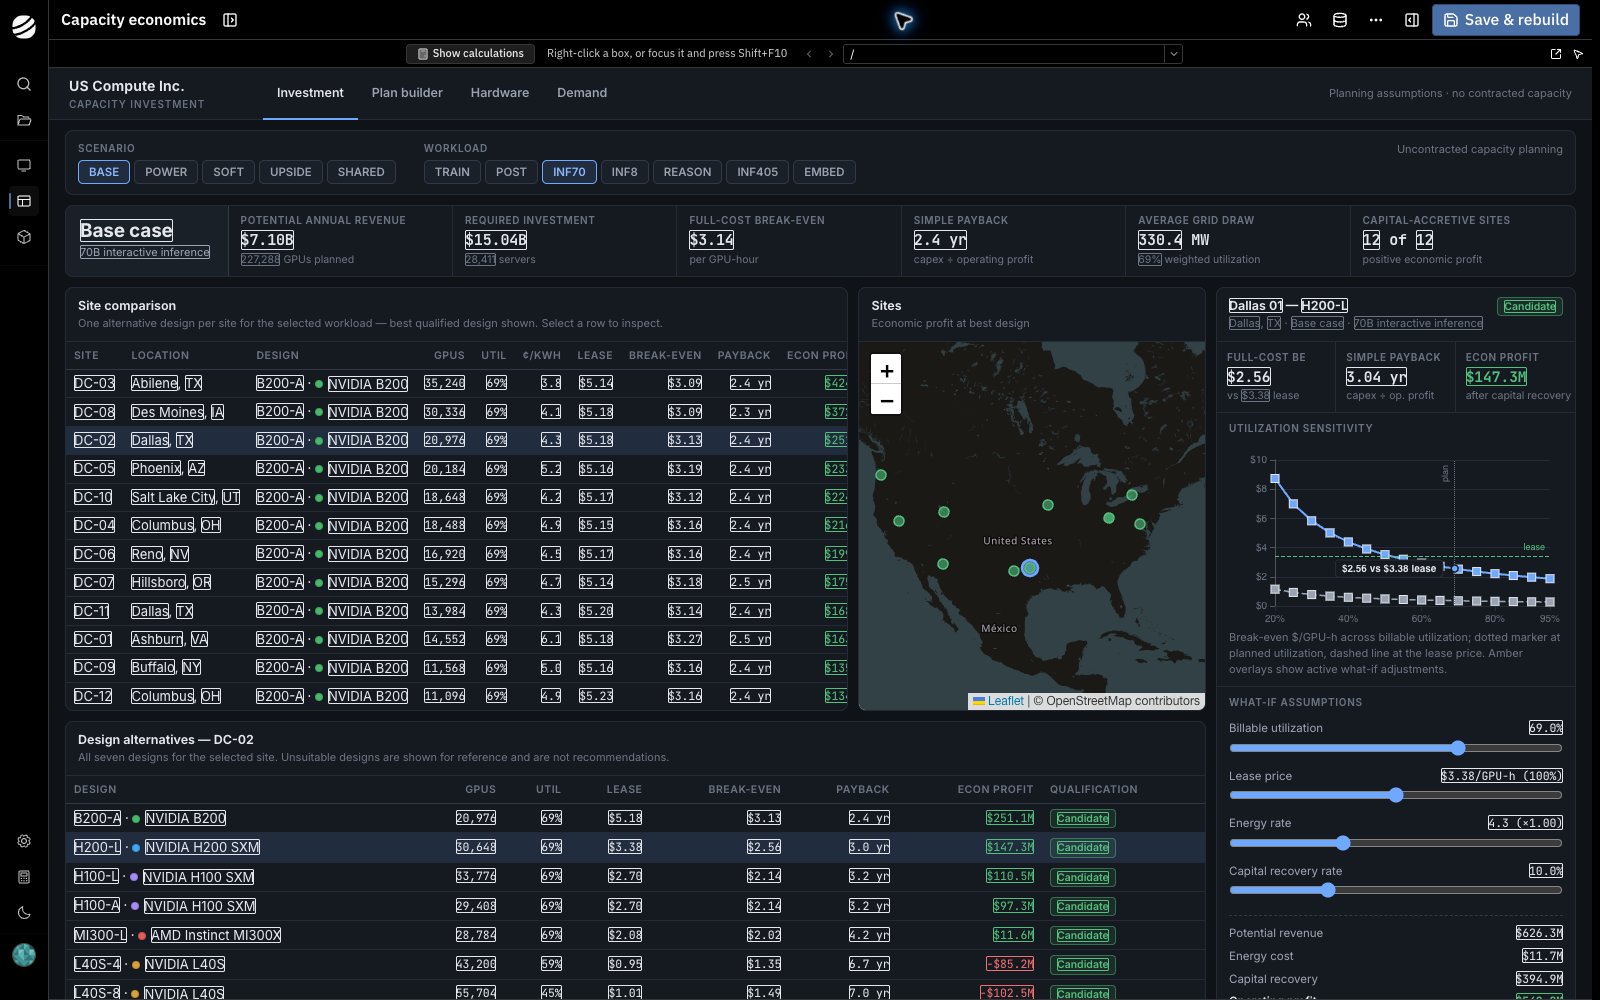
US Compute Inc. is modeling data center investments. Its capacity investment Cord app helps the team test whether a site still makes money when demand softens, then build a capacity plan.
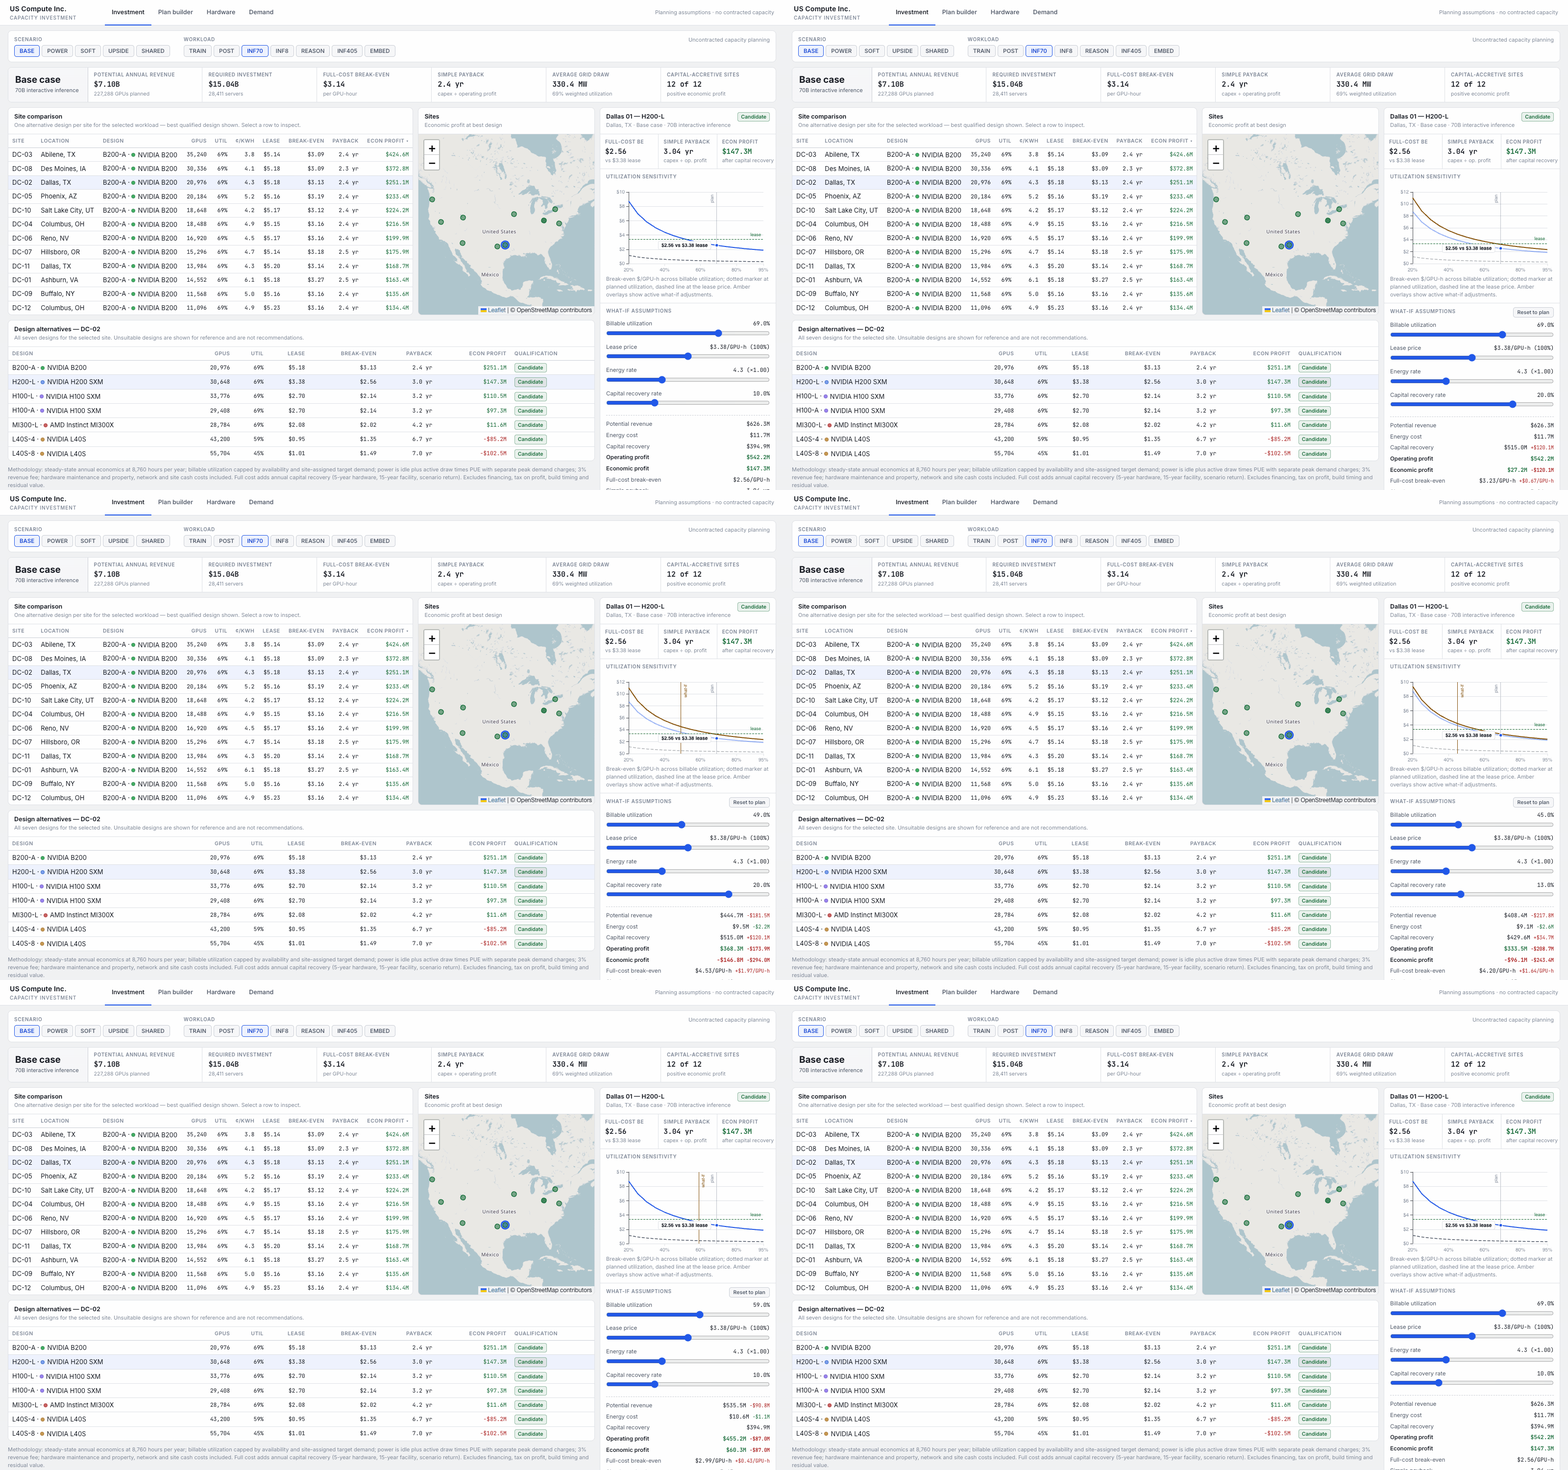
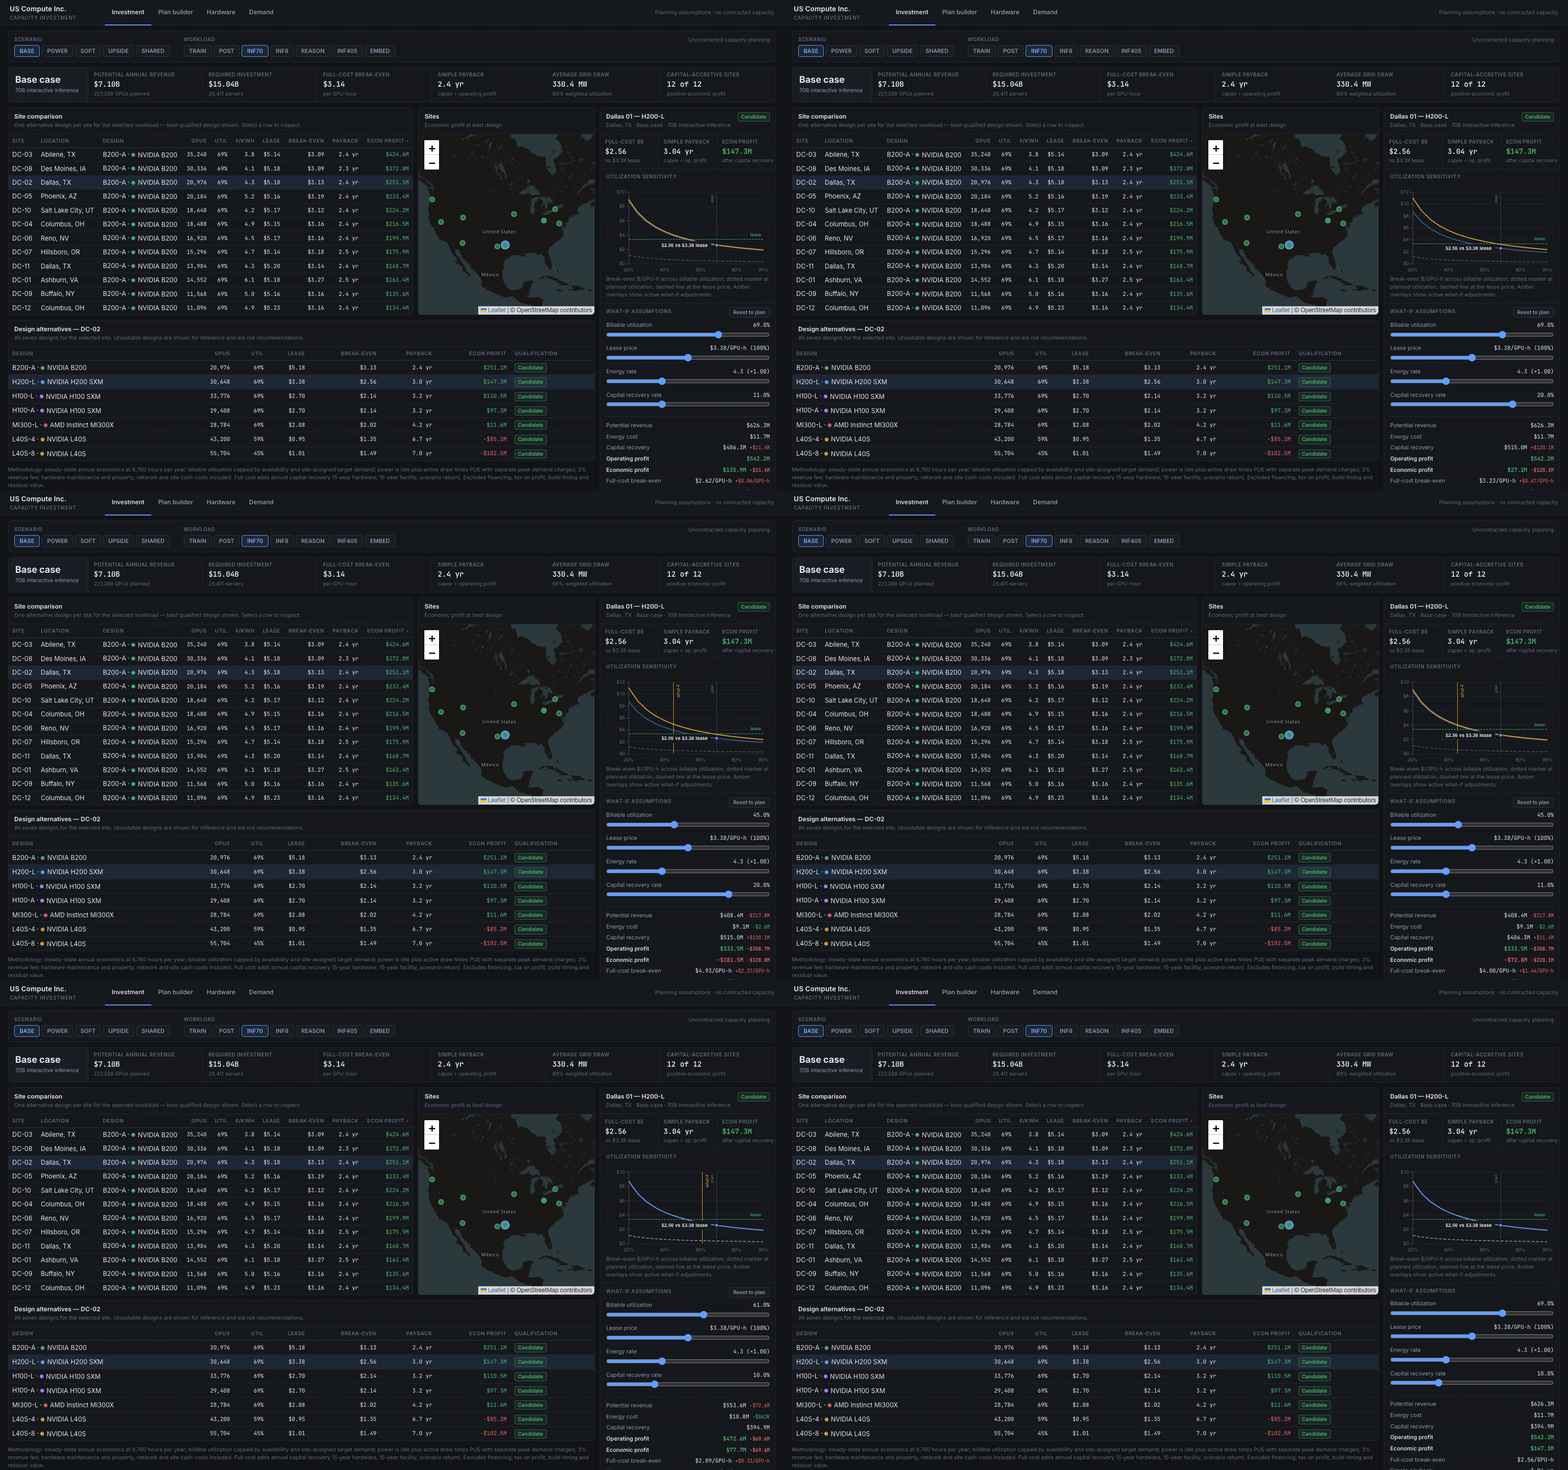
Raise capital recovery, then lower utilization to see their combined effect on site economics.
1
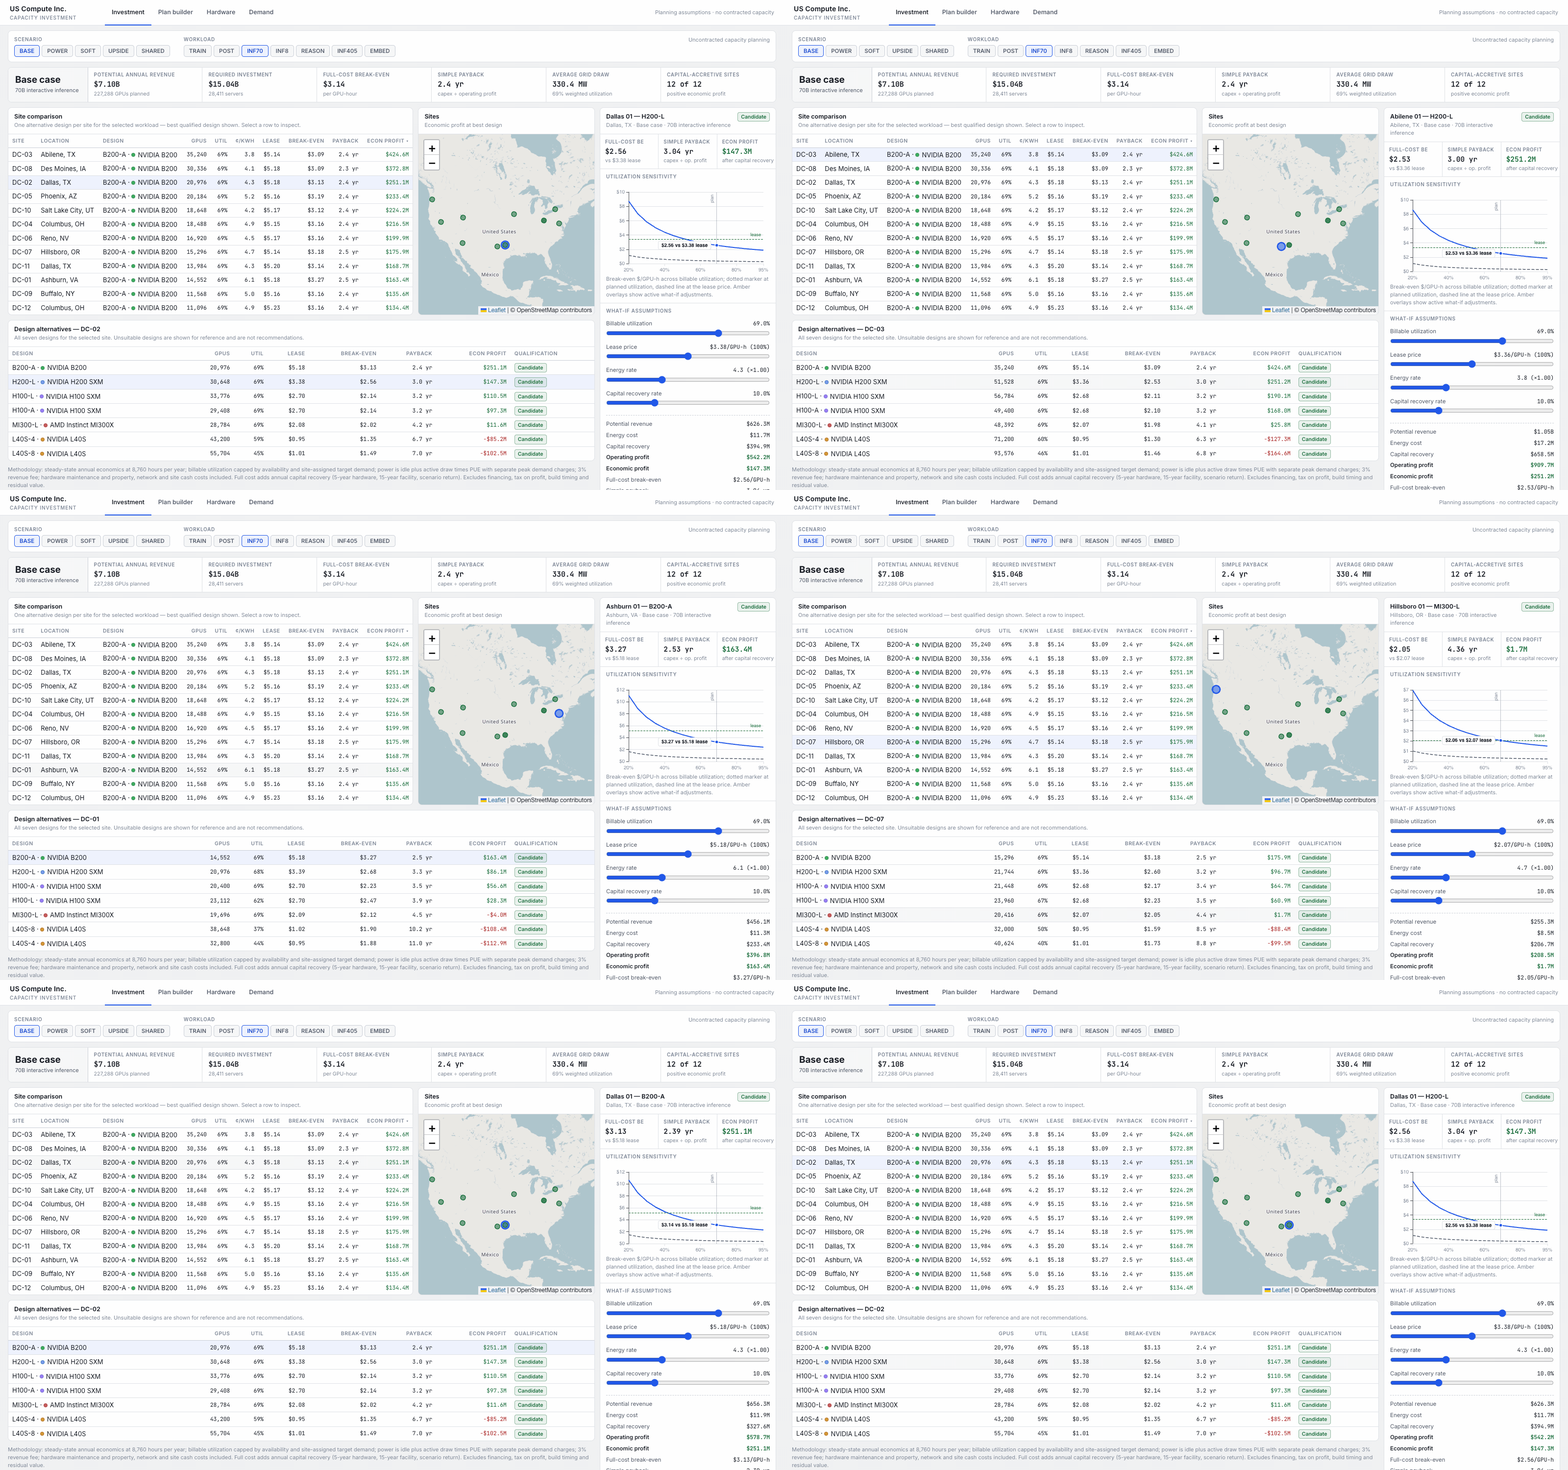
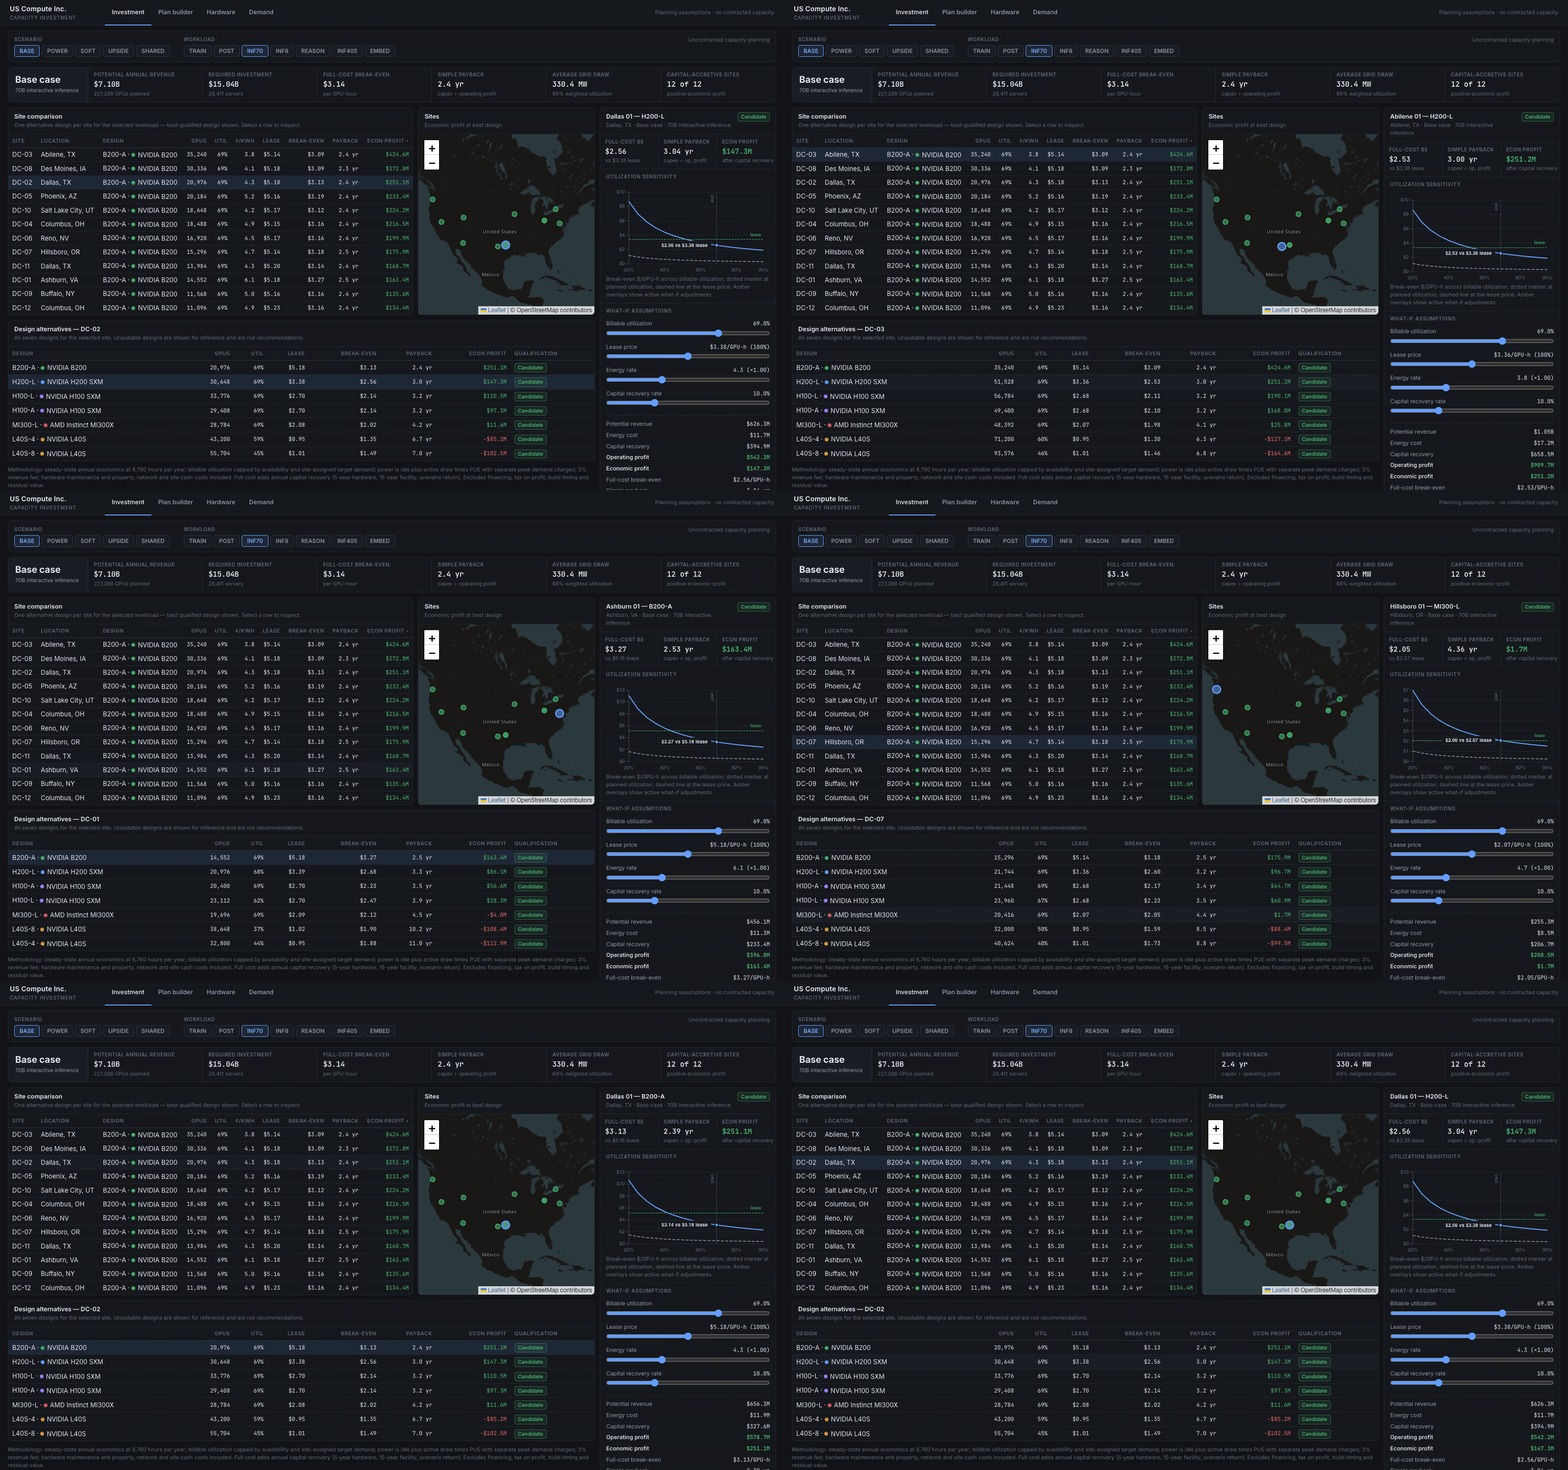
Compare candidate sites
Compare twelve candidate sites, then select a site to inspect its design options, revenue, energy cost, capital recovery, and economic profit. The map follows your selection, and the utilization curve shows how the site’s break-even price changes as utilization changes.
Compare locations and swap GPU designs to see how their economics change.
2
Compare demand scenarios
Switch between the base case and softer or stronger demand. Compare the portfolio totals and the selected site’s break-even price, payback, and economic profit. Change the workload to see how the investment depends on what the capacity will serve.
Switch demand scenarios and workloads to compare portfolio totals and site economics.
3
Understand the result
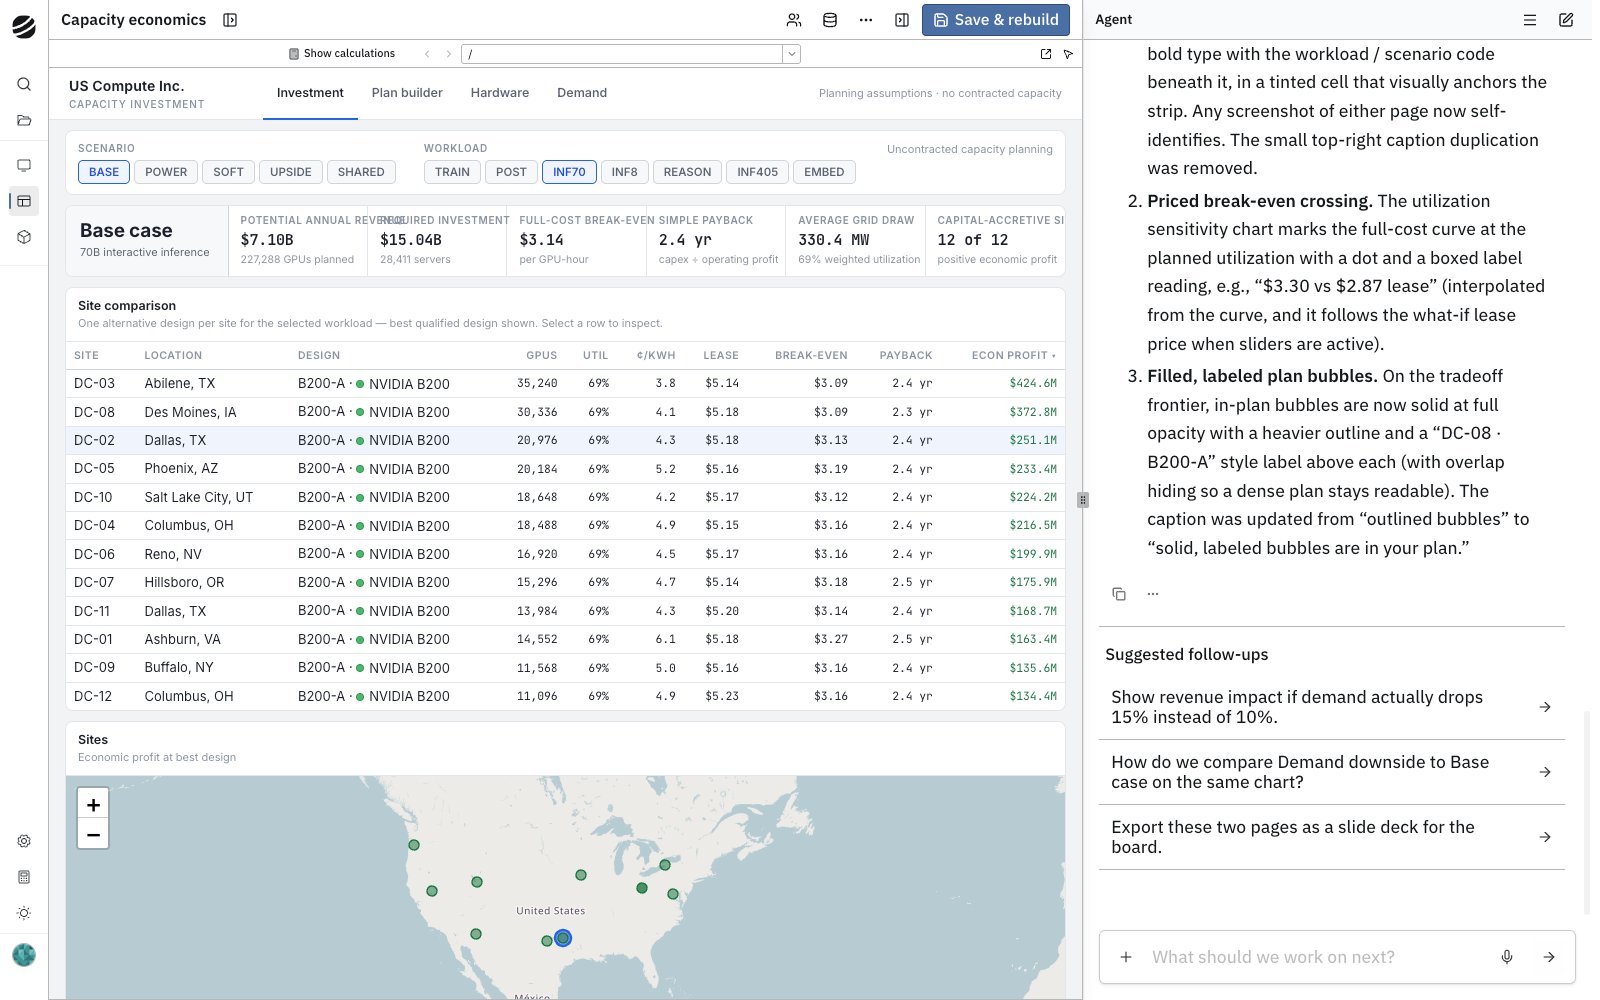
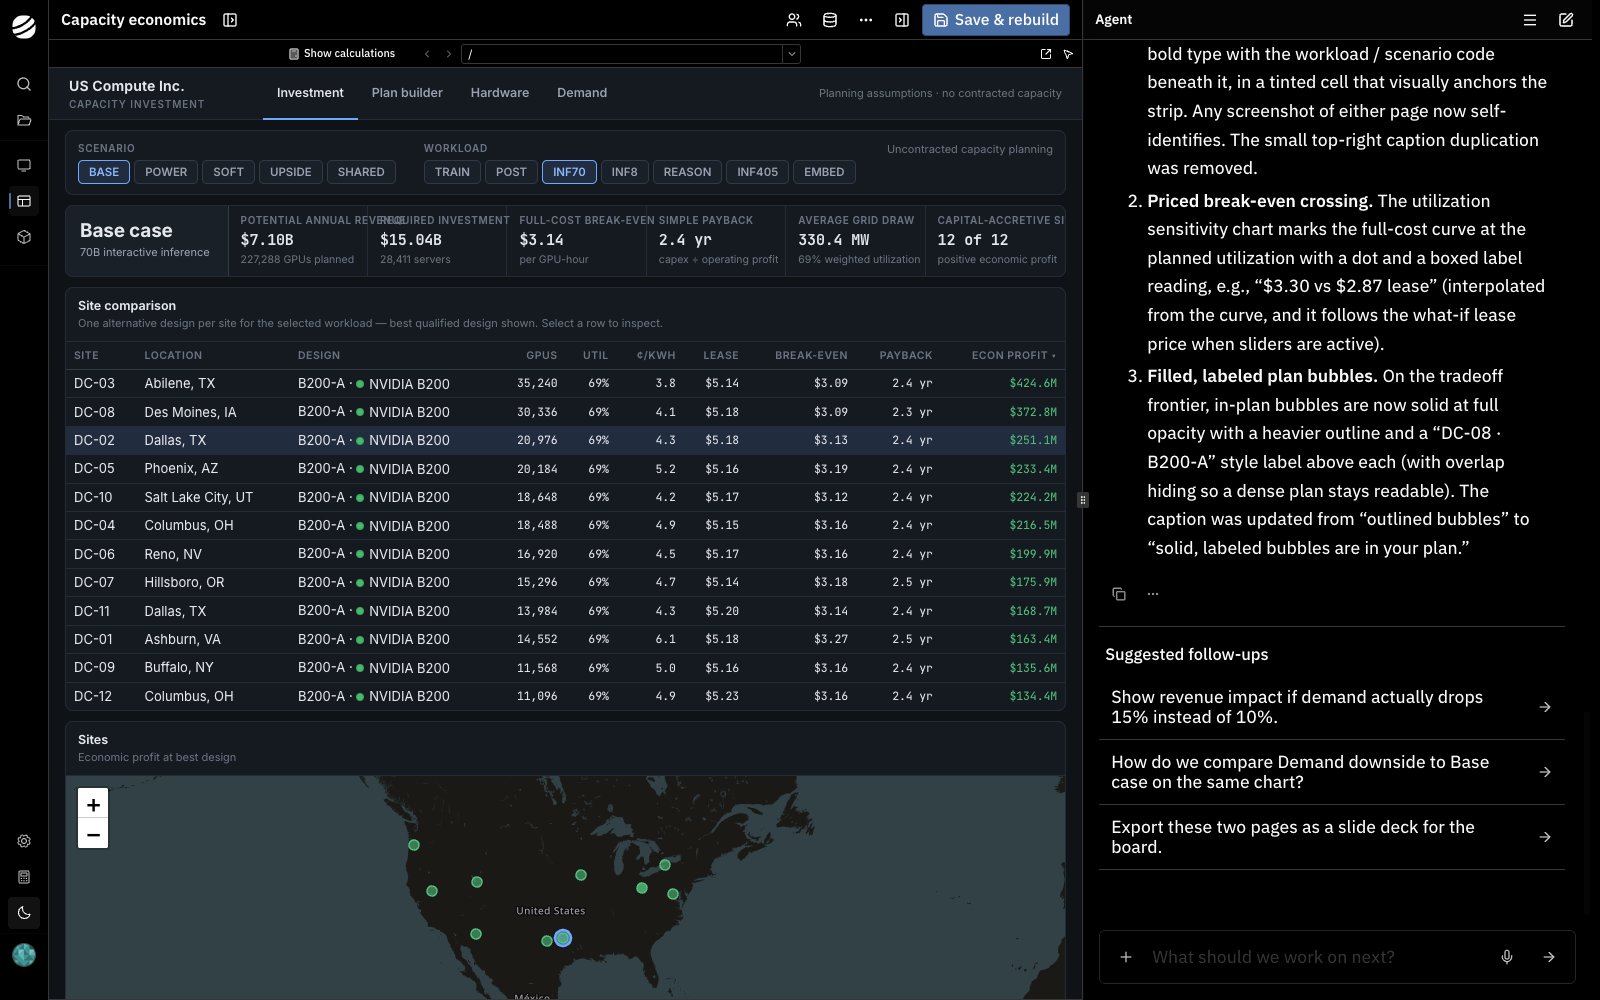
Open the app in Application Studio and ask the agent to explain the change using the app’s figures. Follow how utilization, lease price, and capital recovery affect the result.
Application Studio with the capacity investment app beside the conversation used to improve it.
4
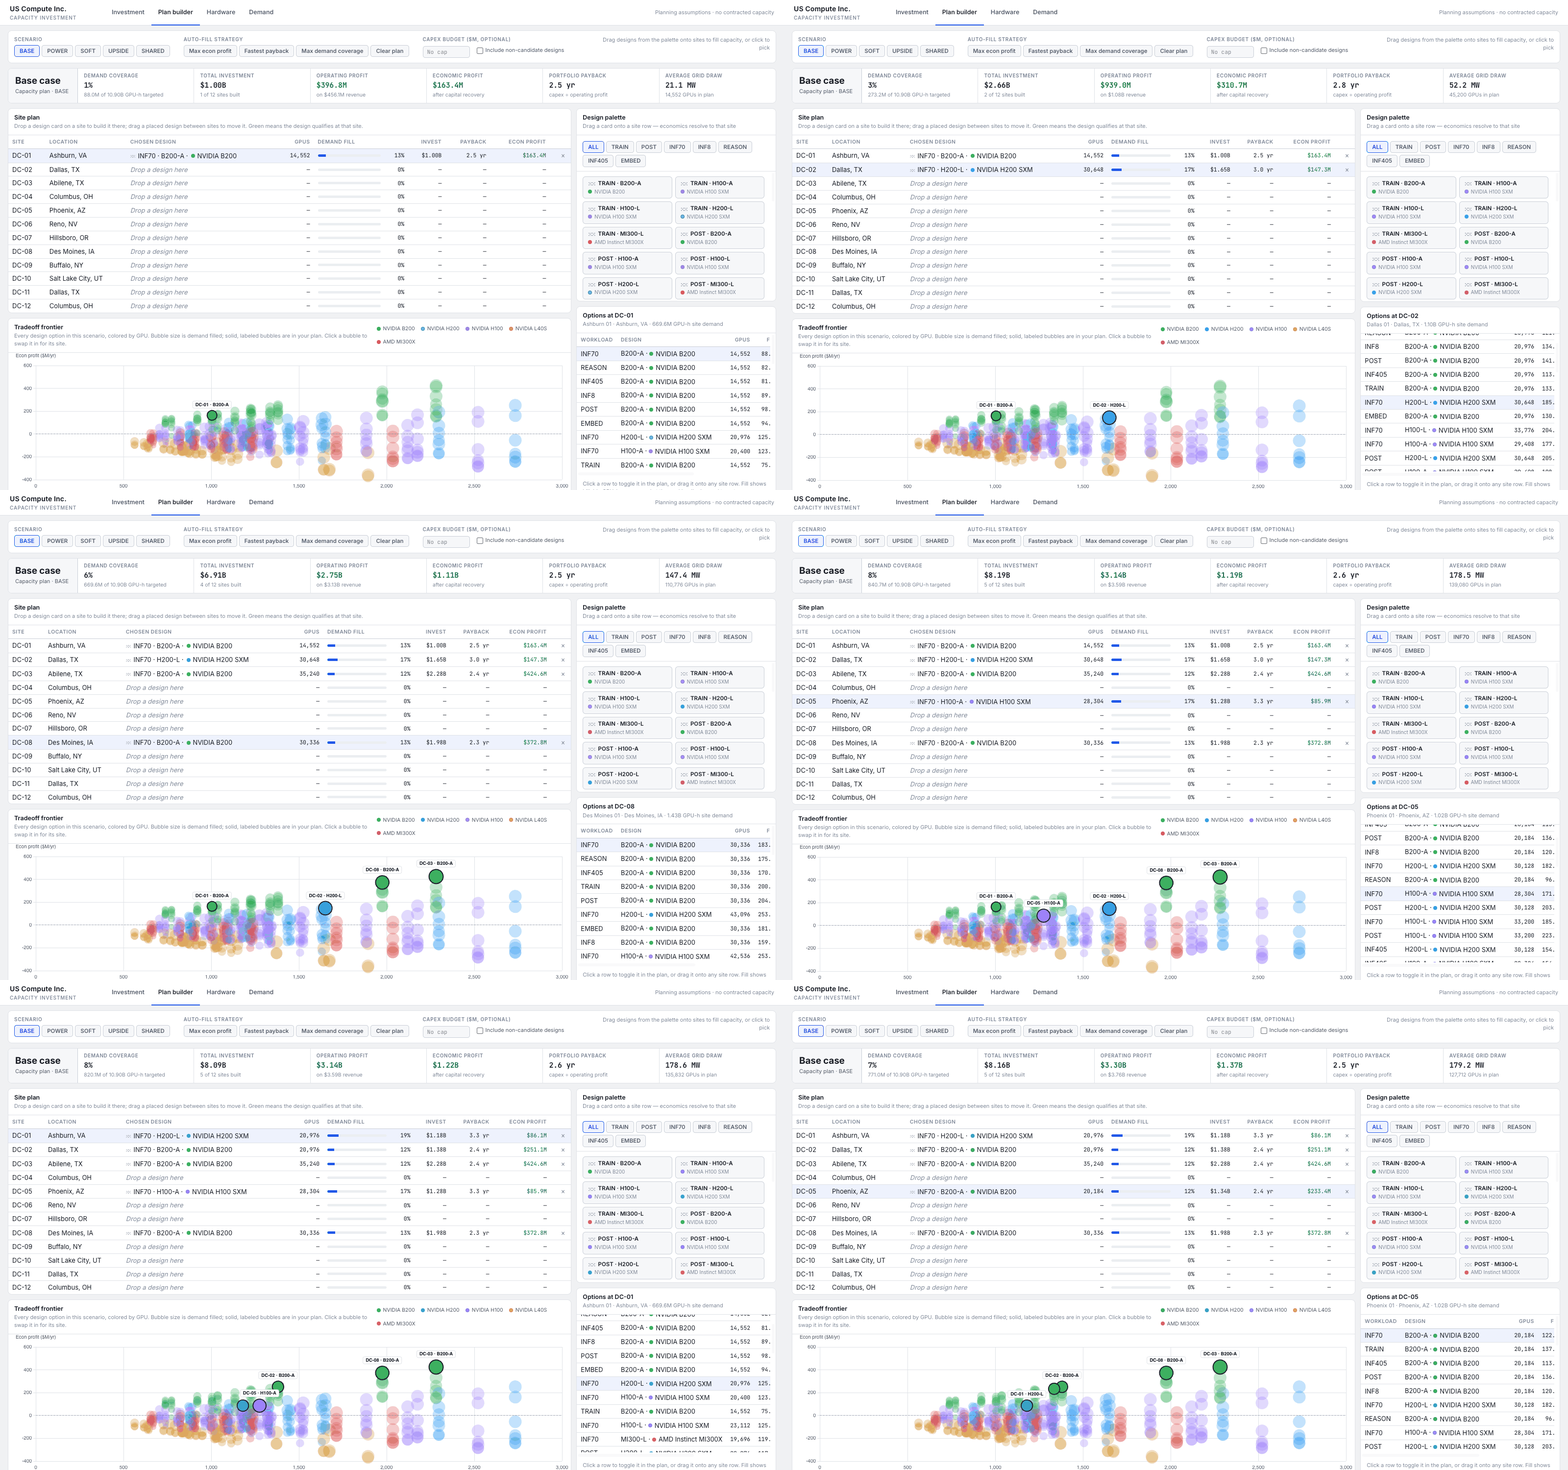
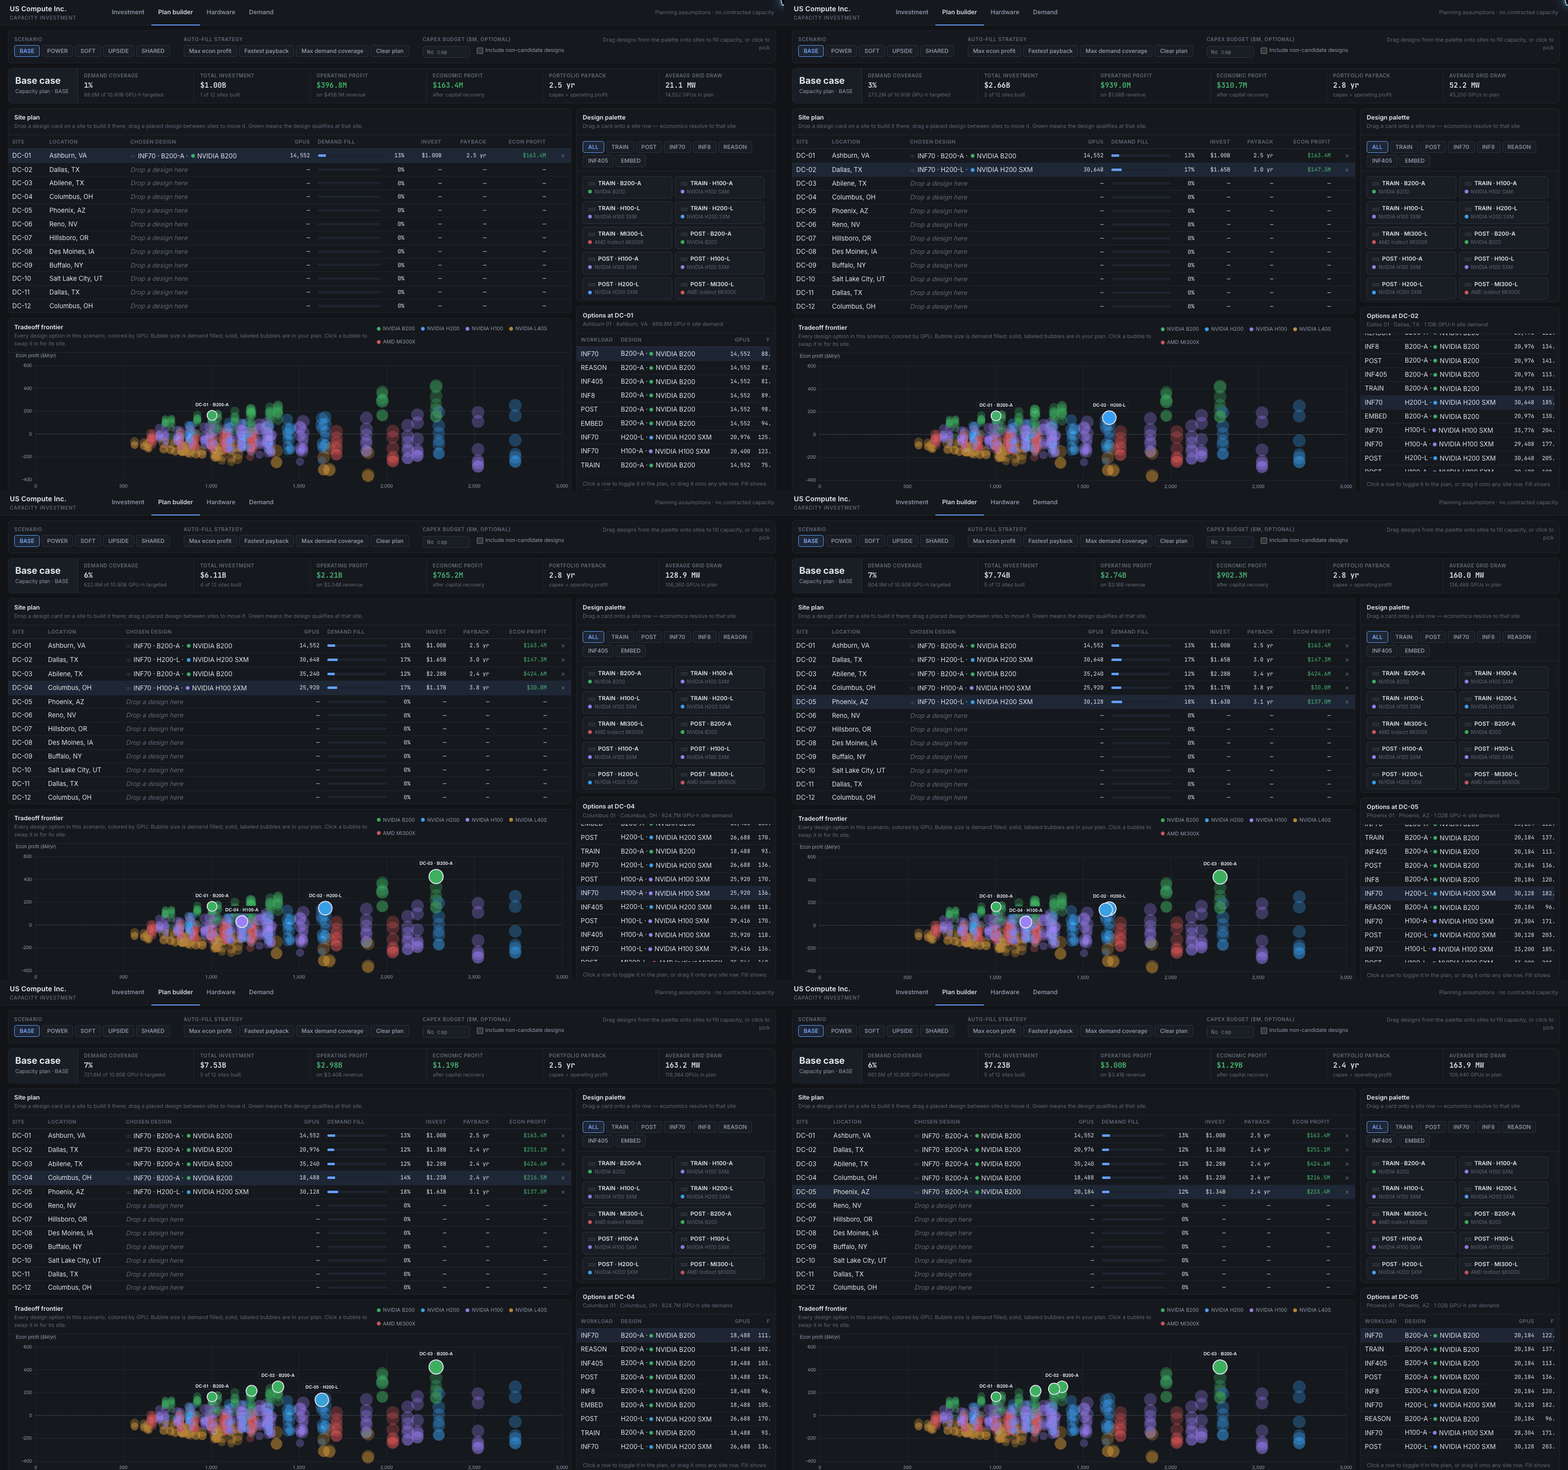
Build the investment plan
In the plan builder, select a site and click a compute design to add it to the plan. Add more sites or swap individual designs, then compare investment, economic profit, and the tradeoff chart.
Click compute designs to build the plan site by site, then swap designs to compare the result.
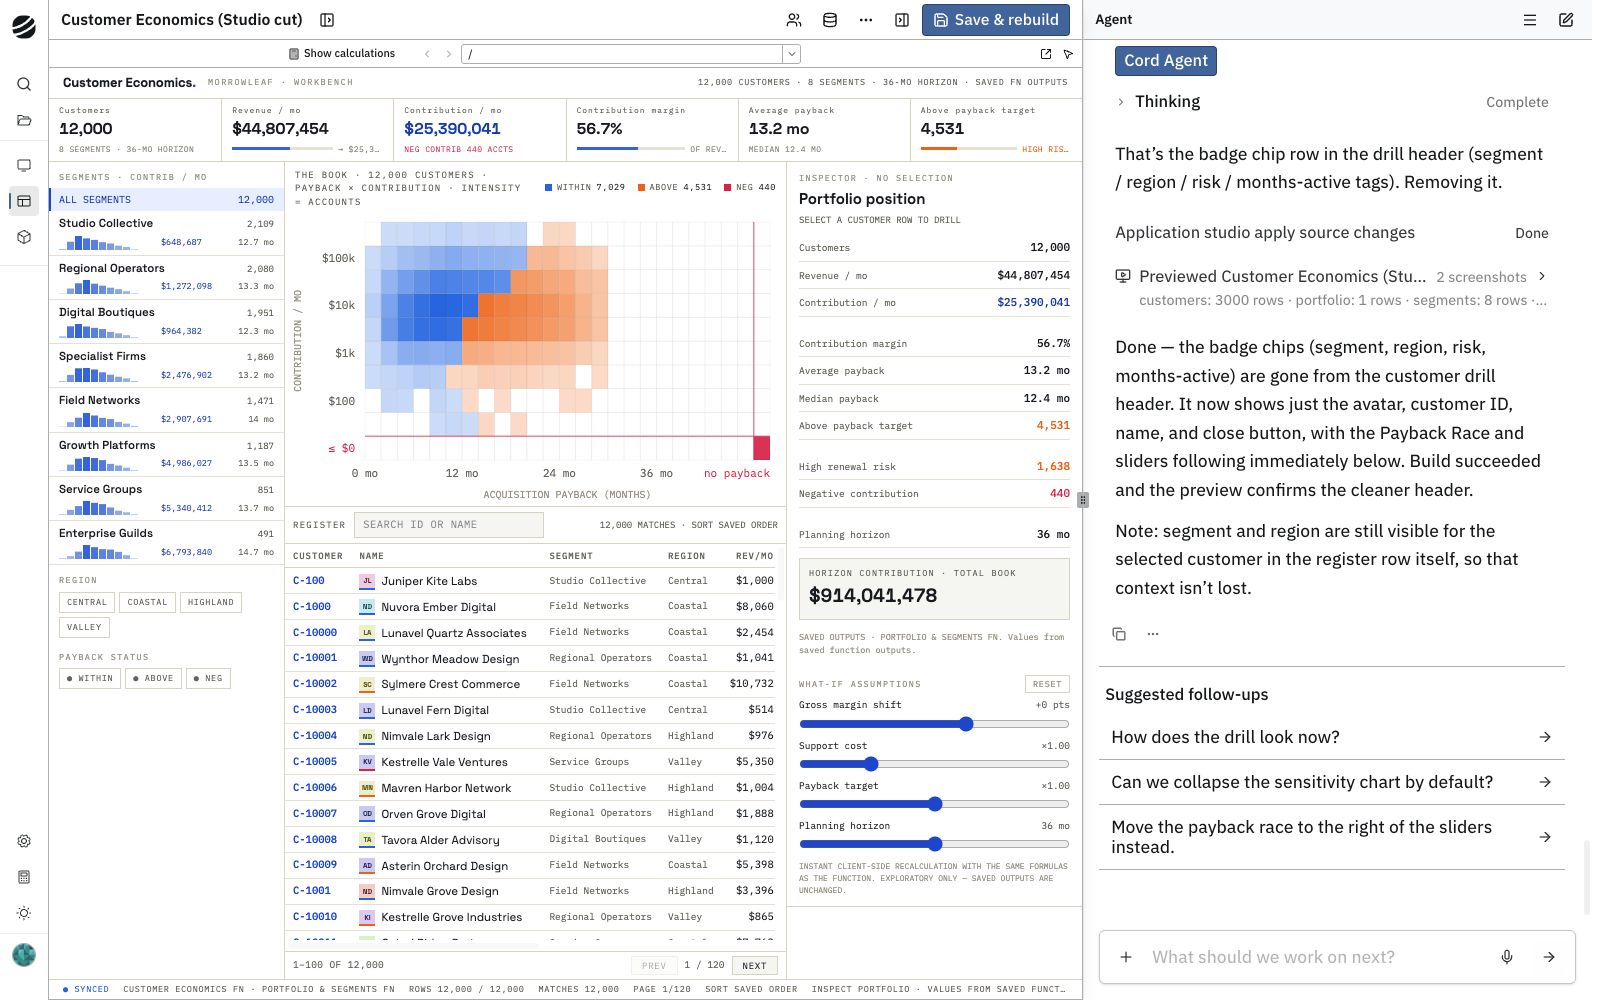
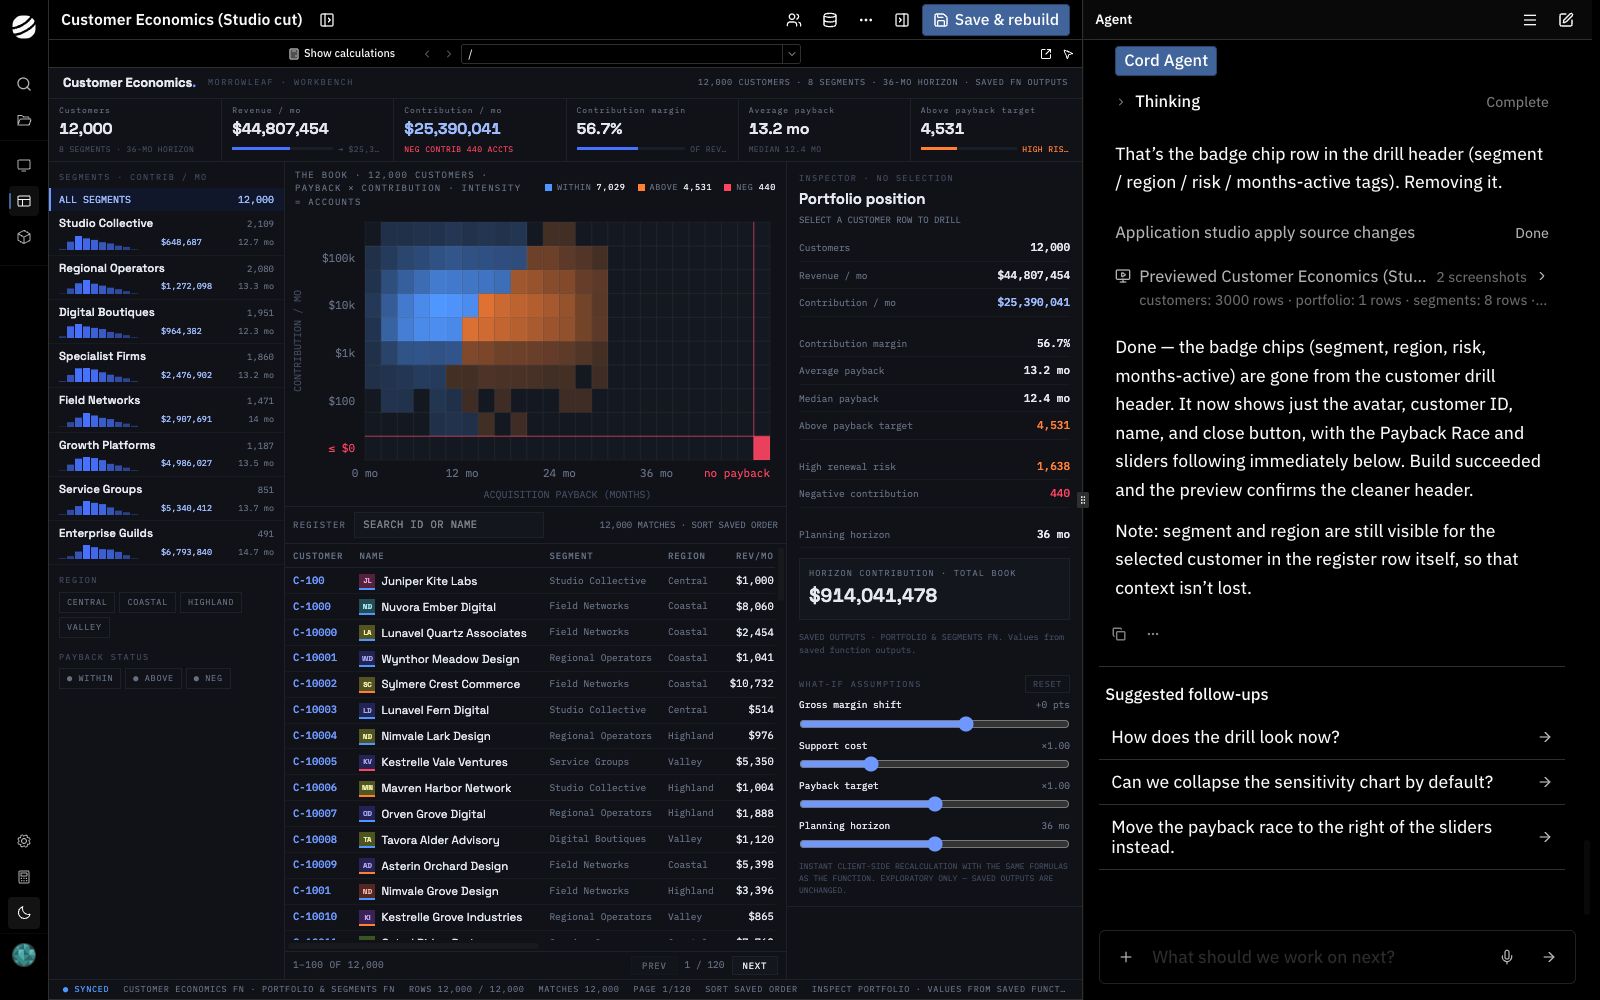
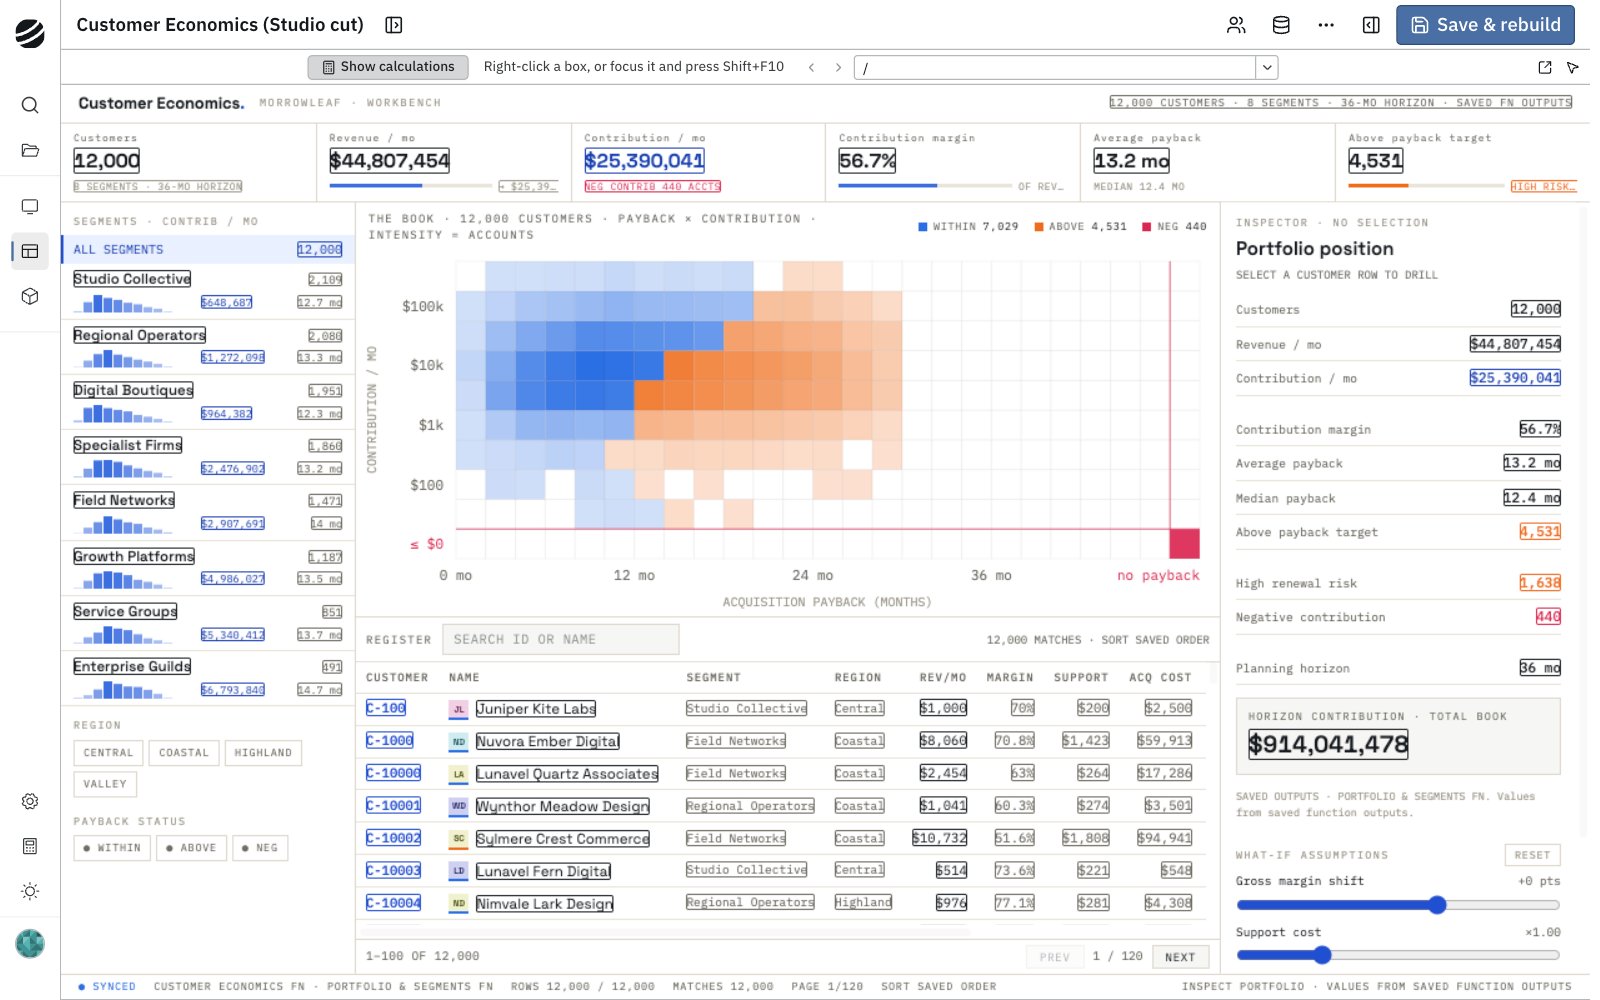
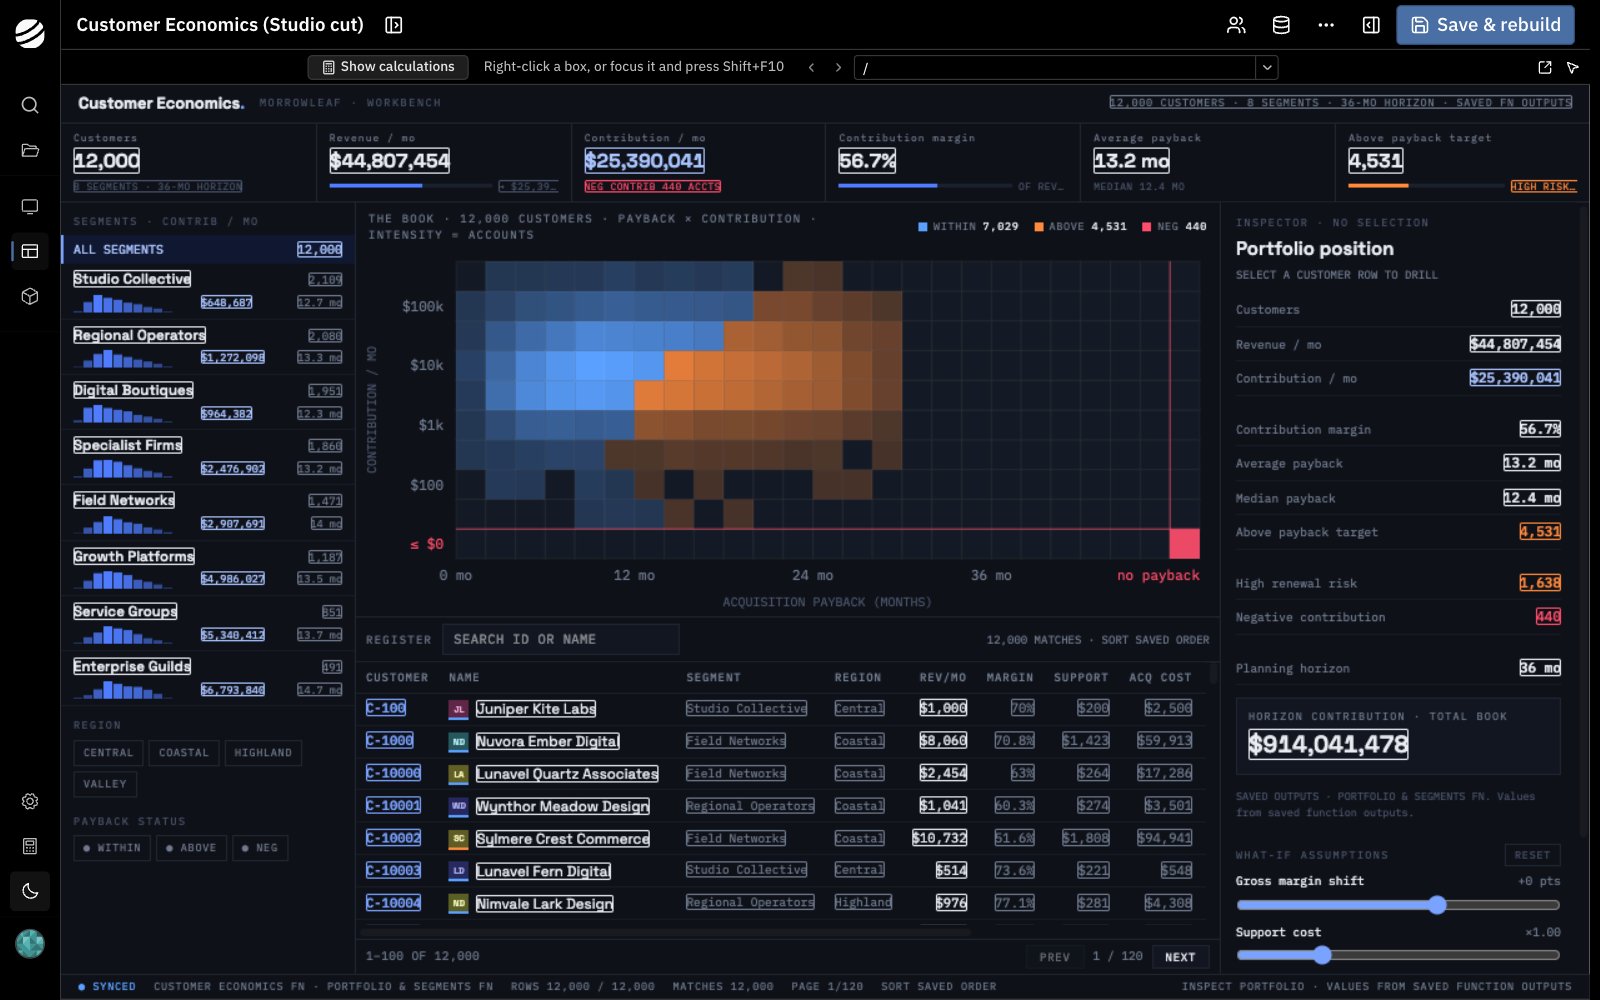
Which customers become less profitable as costs change?
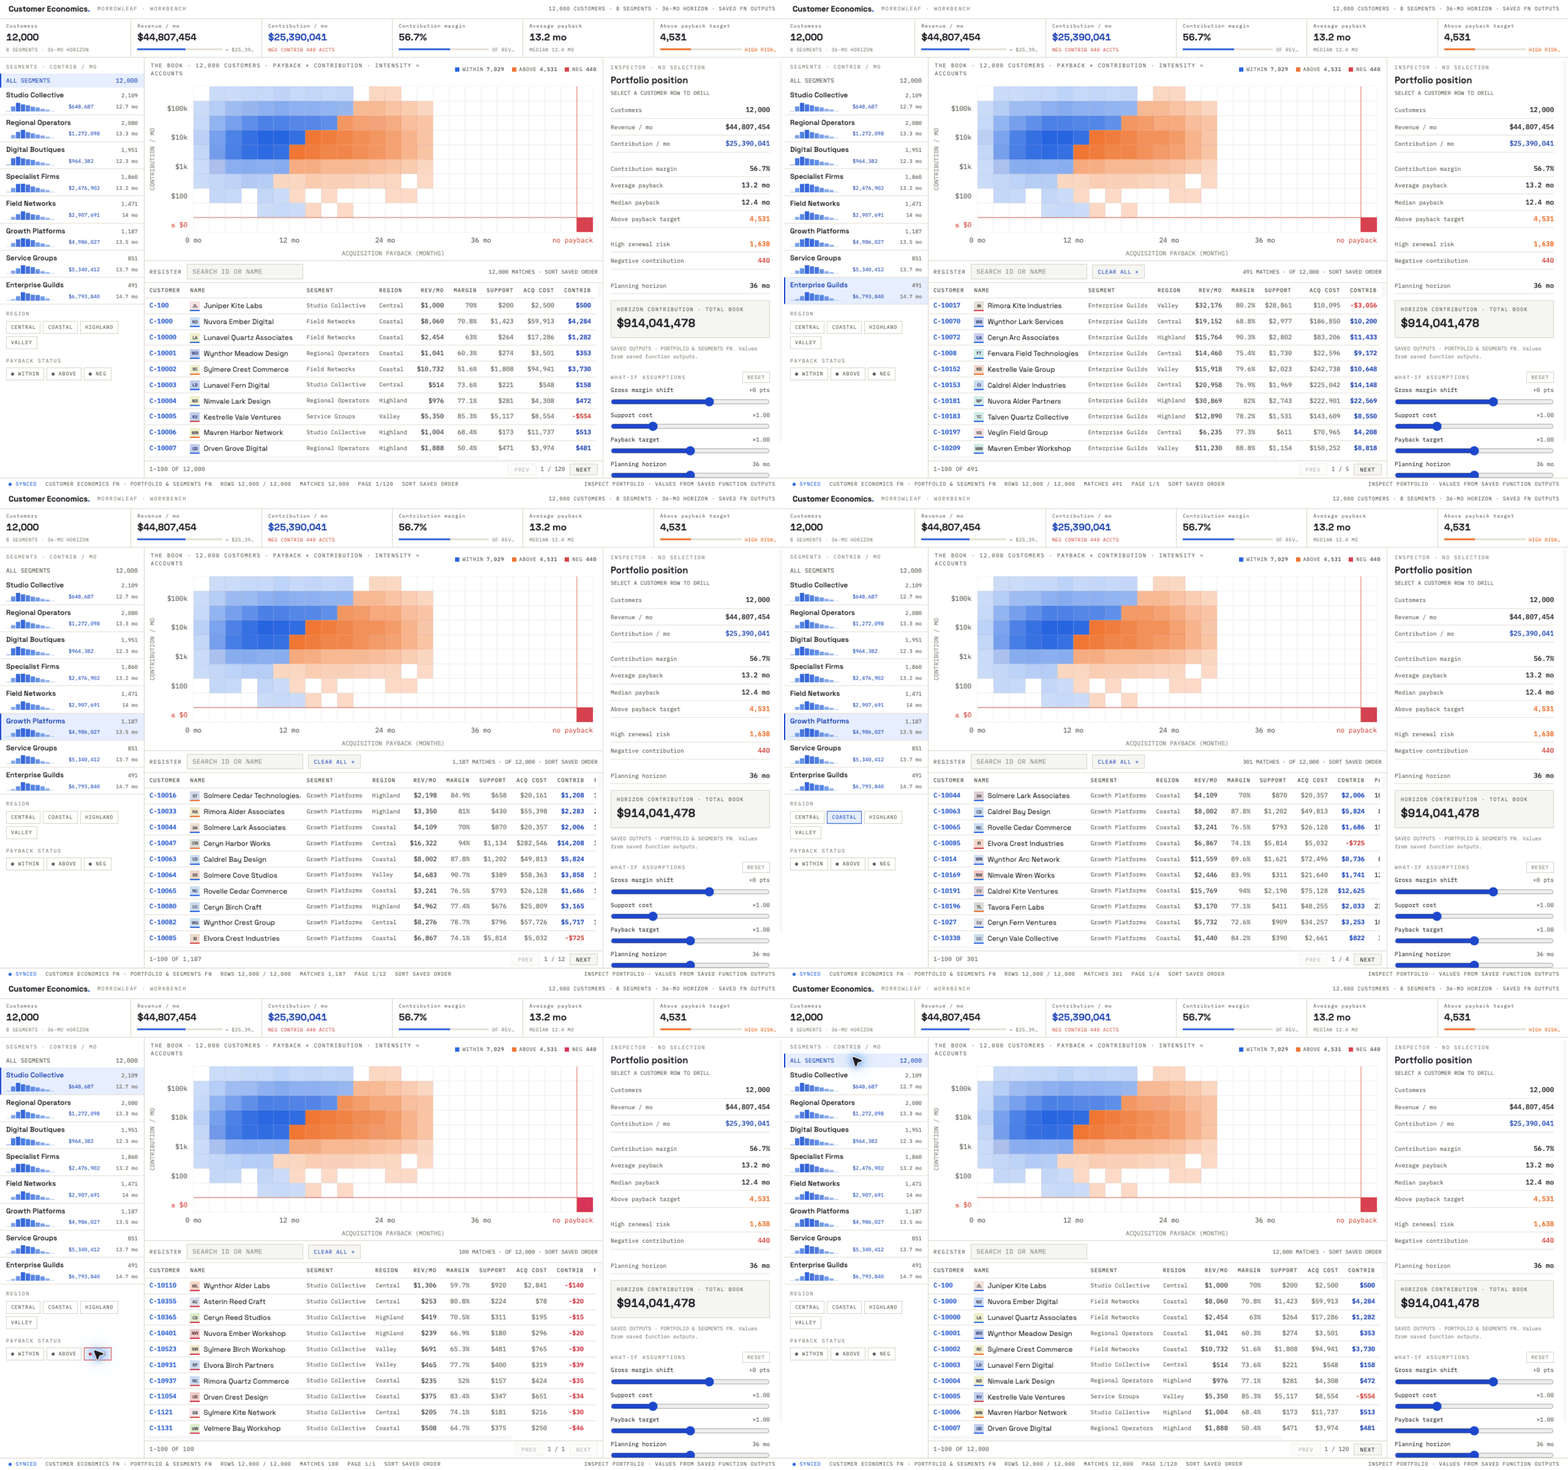
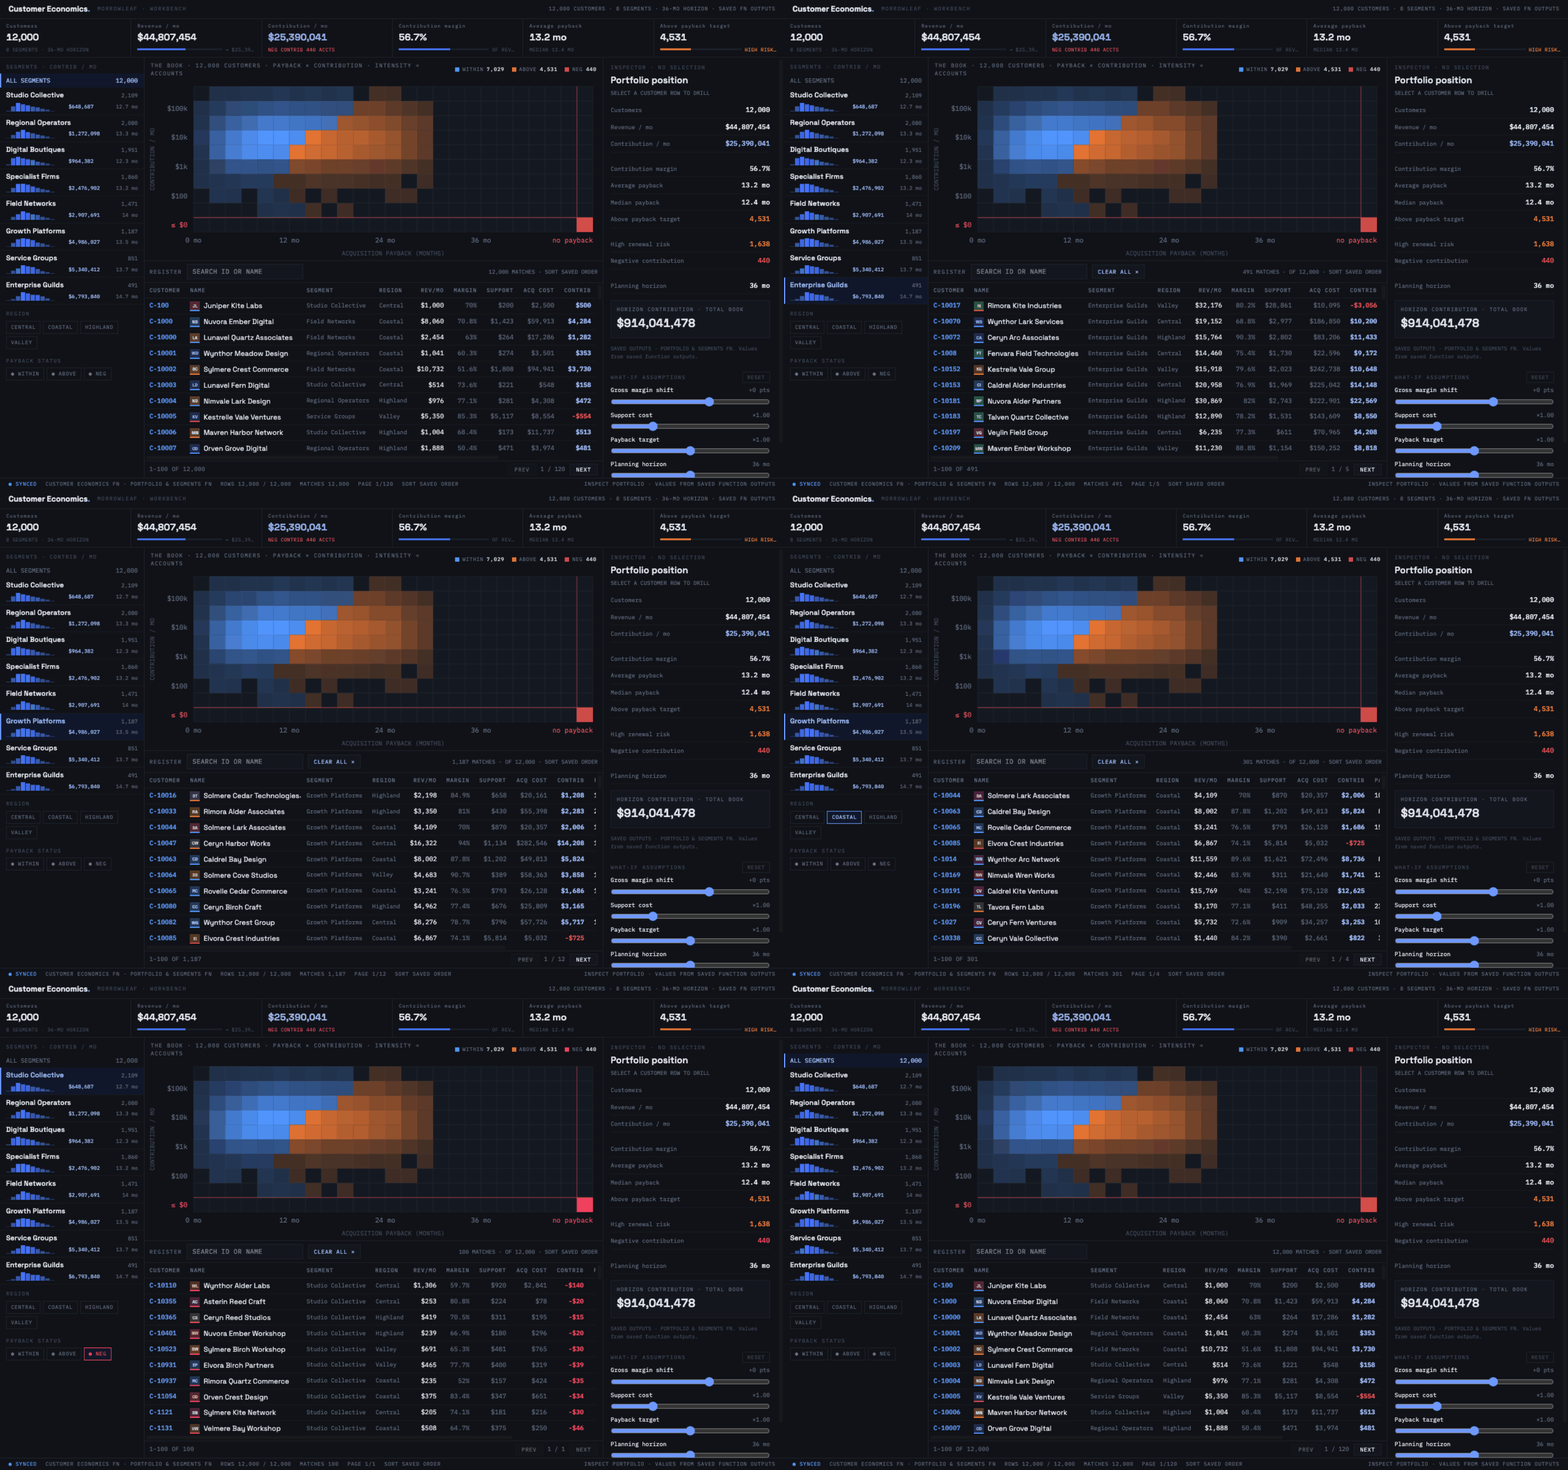
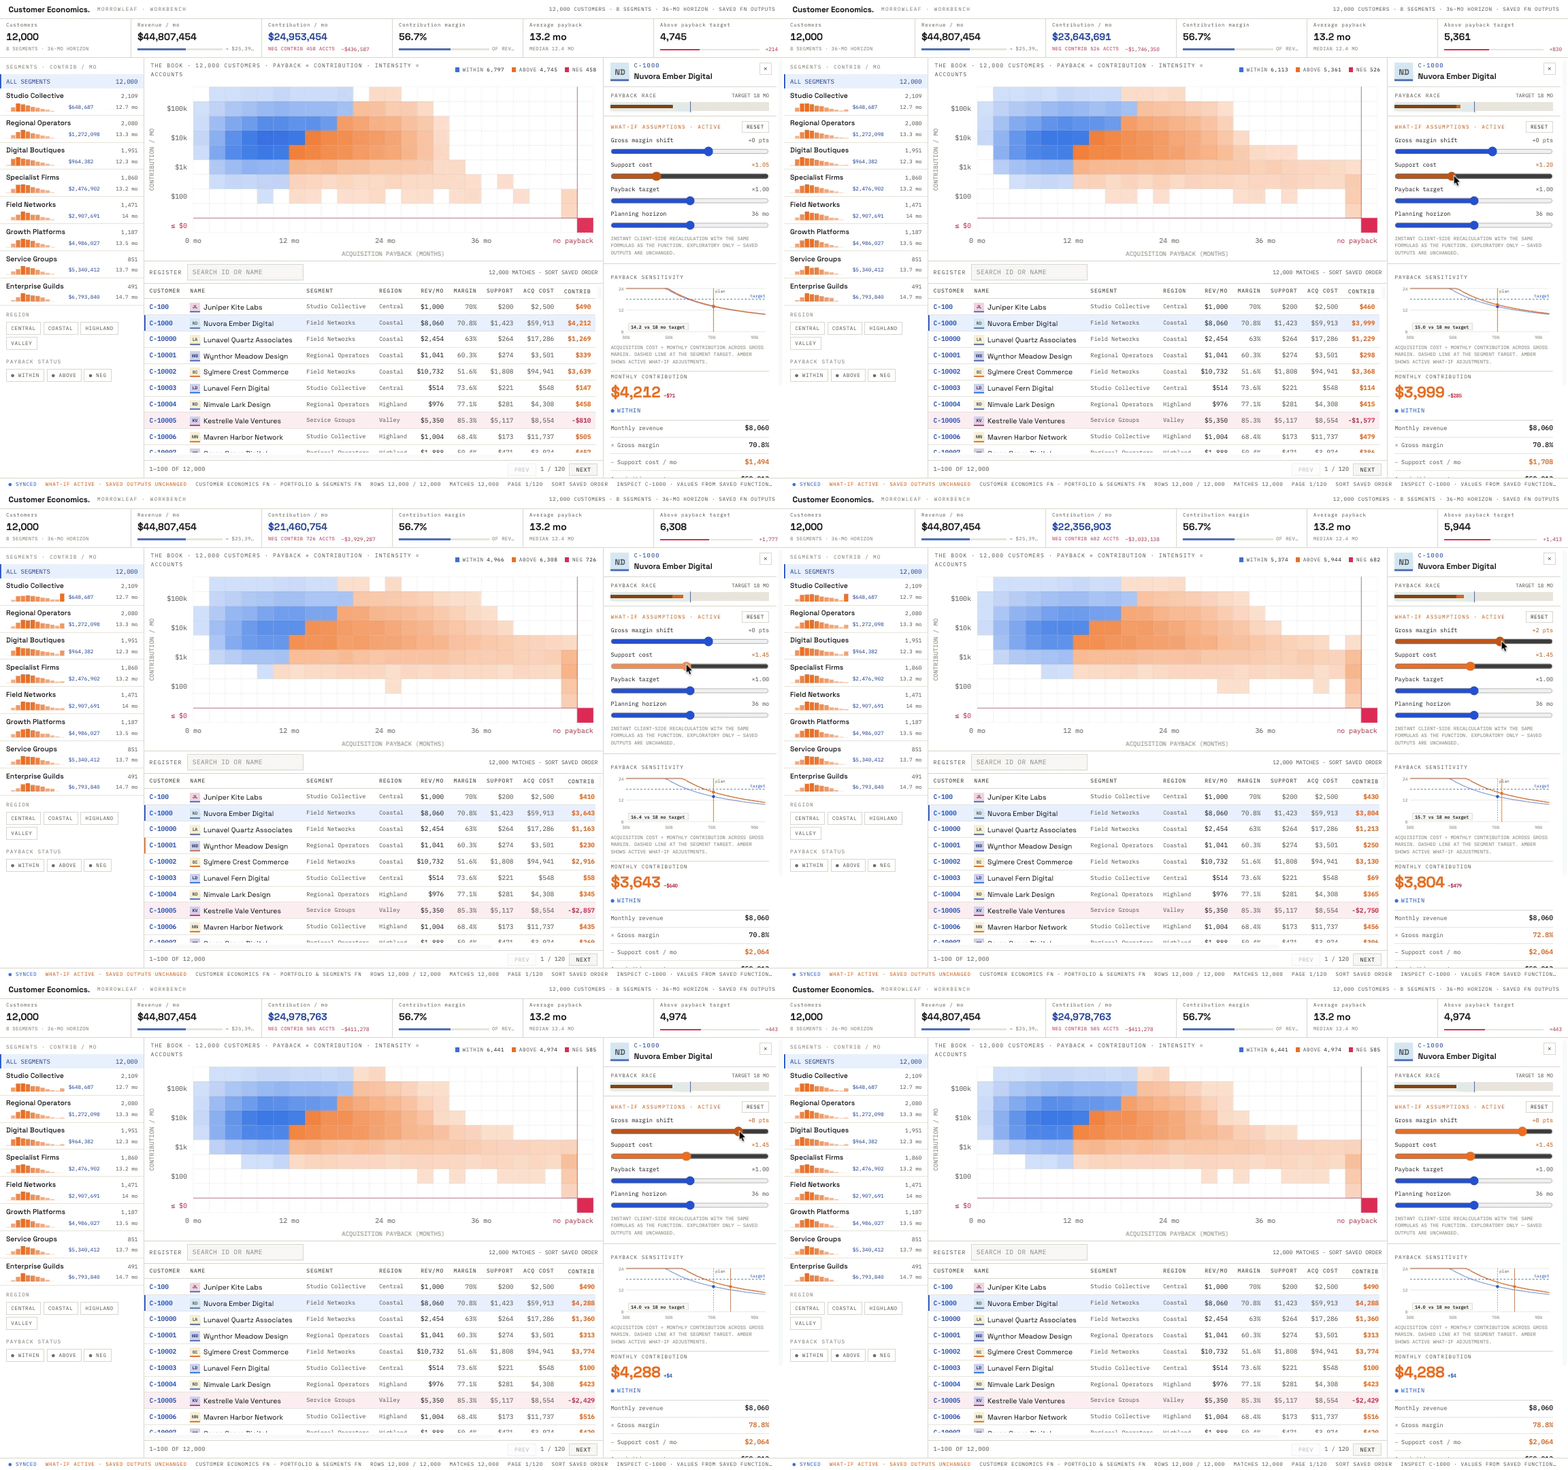
This app helps a team understand customer contribution and payback, test changes in margin and support cost, and inspect the customers affected.
1
Start with the portfolio
Review the saved results for 12,000 customers. Compare segments and identify customers whose payback period exceeds their segment’s target.
Compare segments, regions, and payback status to find the customers to inspect.
2
Change the assumptions
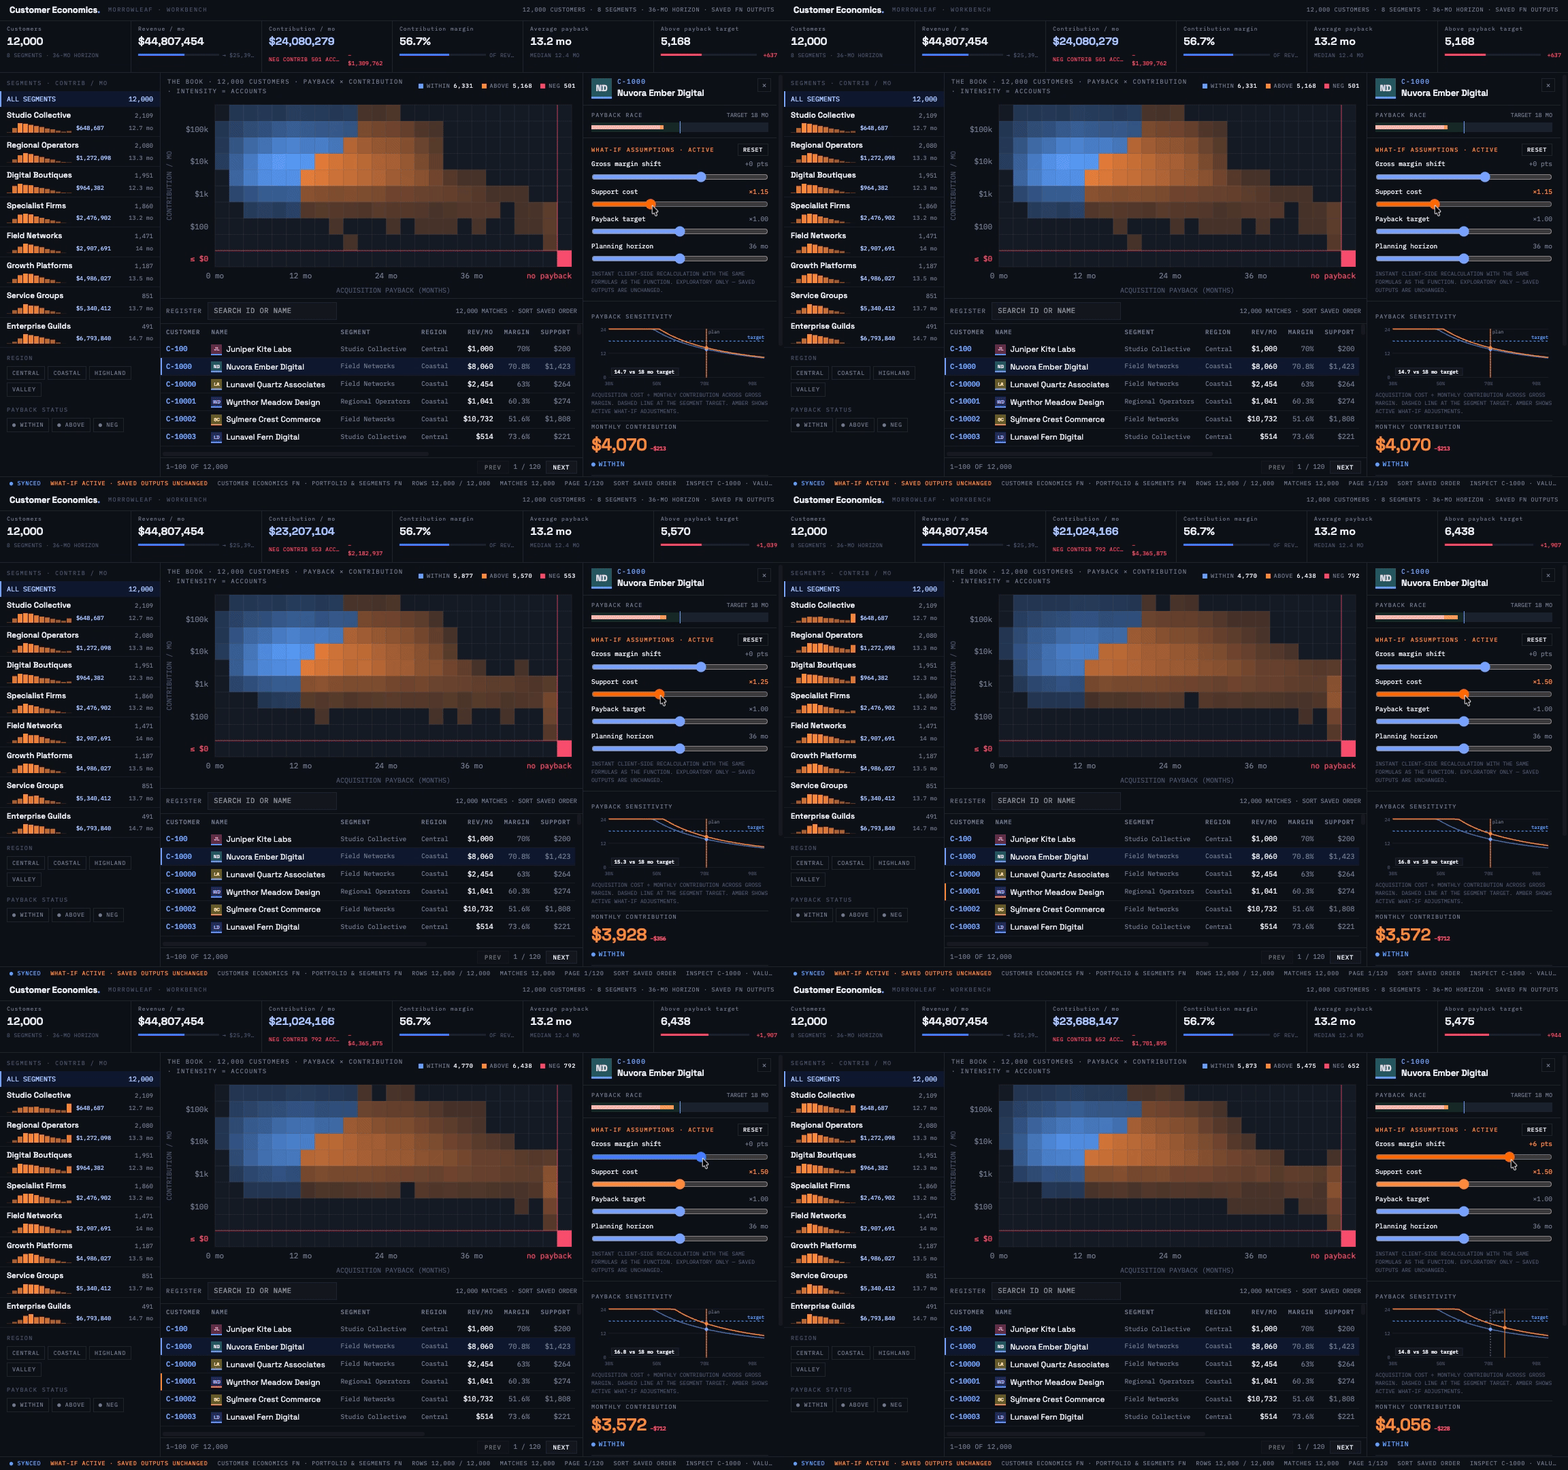
Move the support cost and gross margin sliders. Watch contribution, payback, and the customer heatmap update as you explore the impact on the portfolio.
Change support cost and gross margin to see how customer economics respond.
3
Inspect a customer
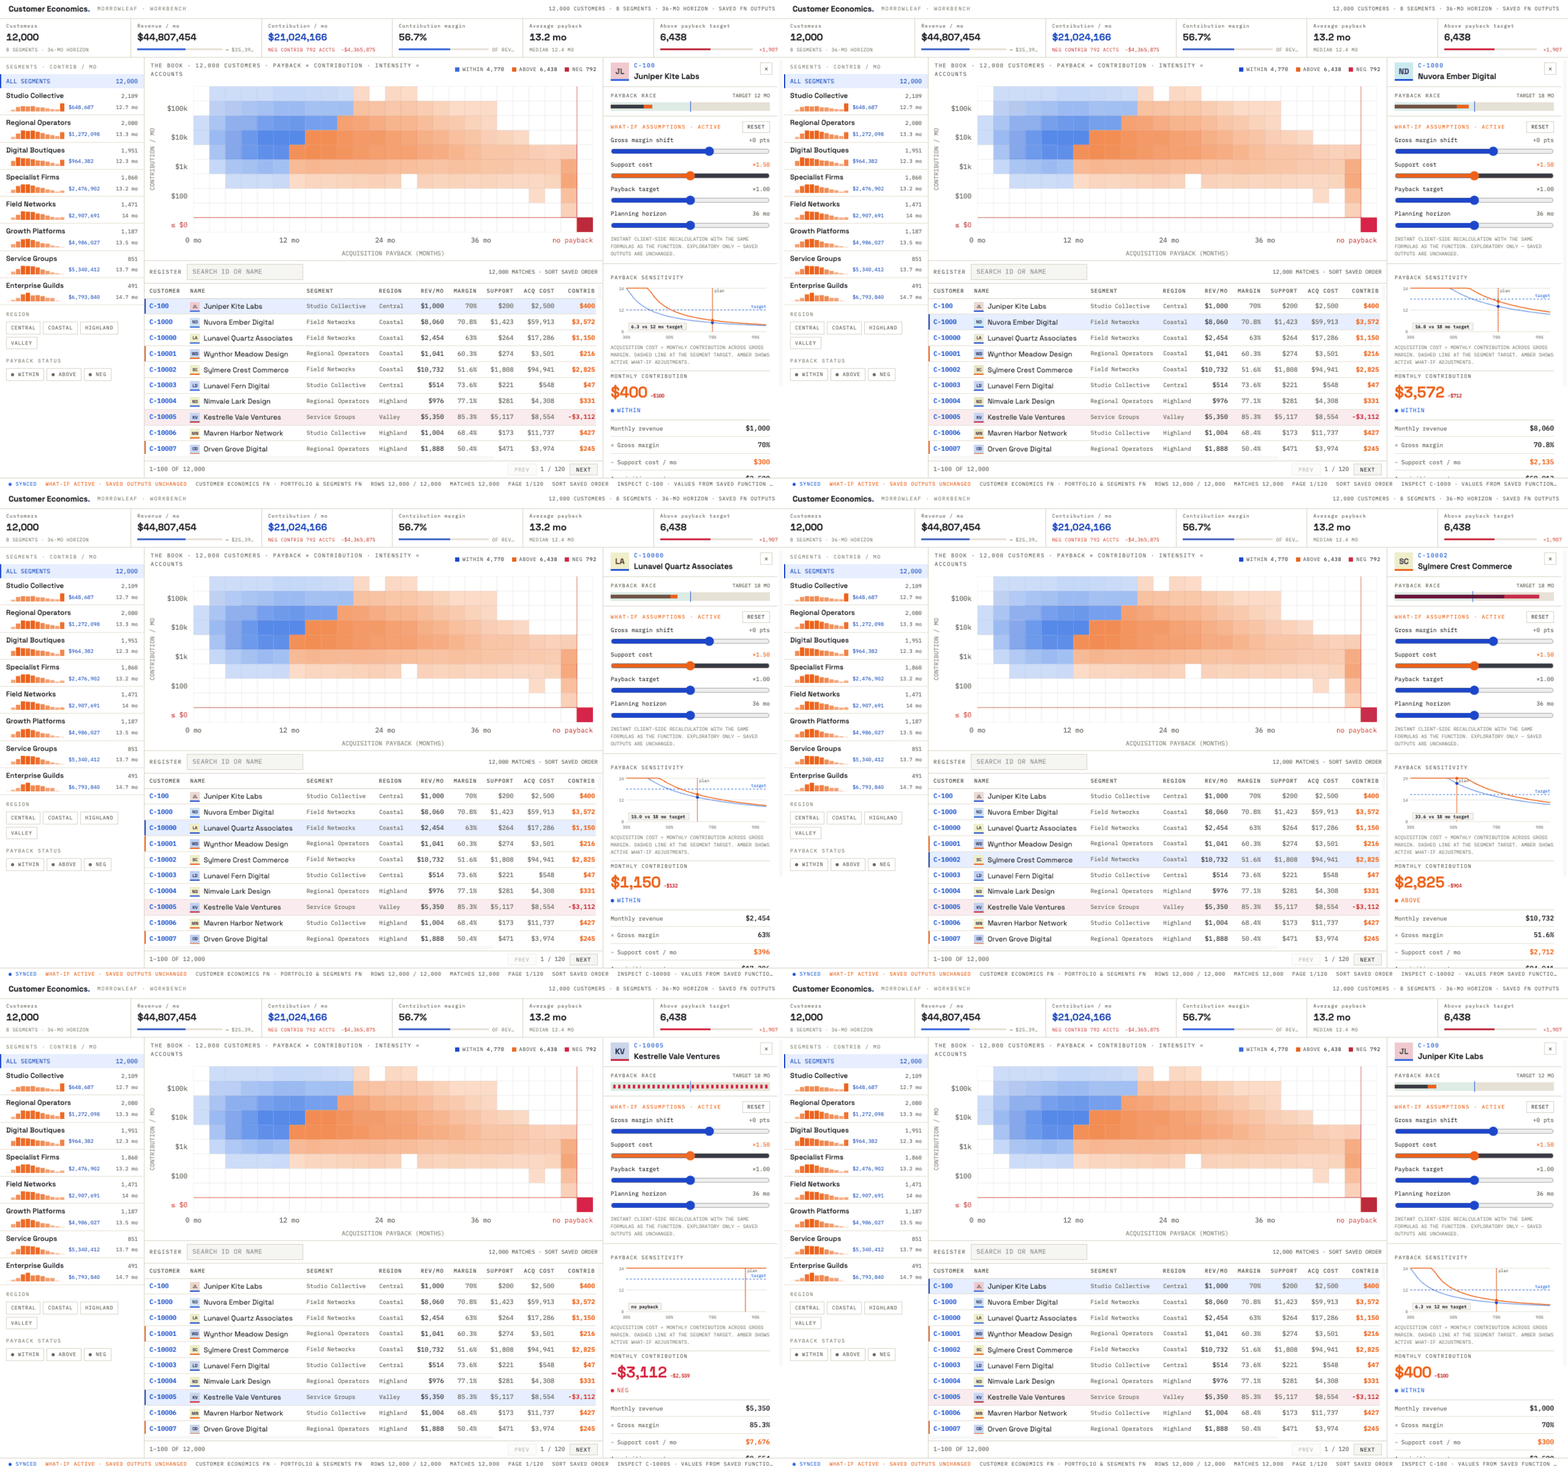
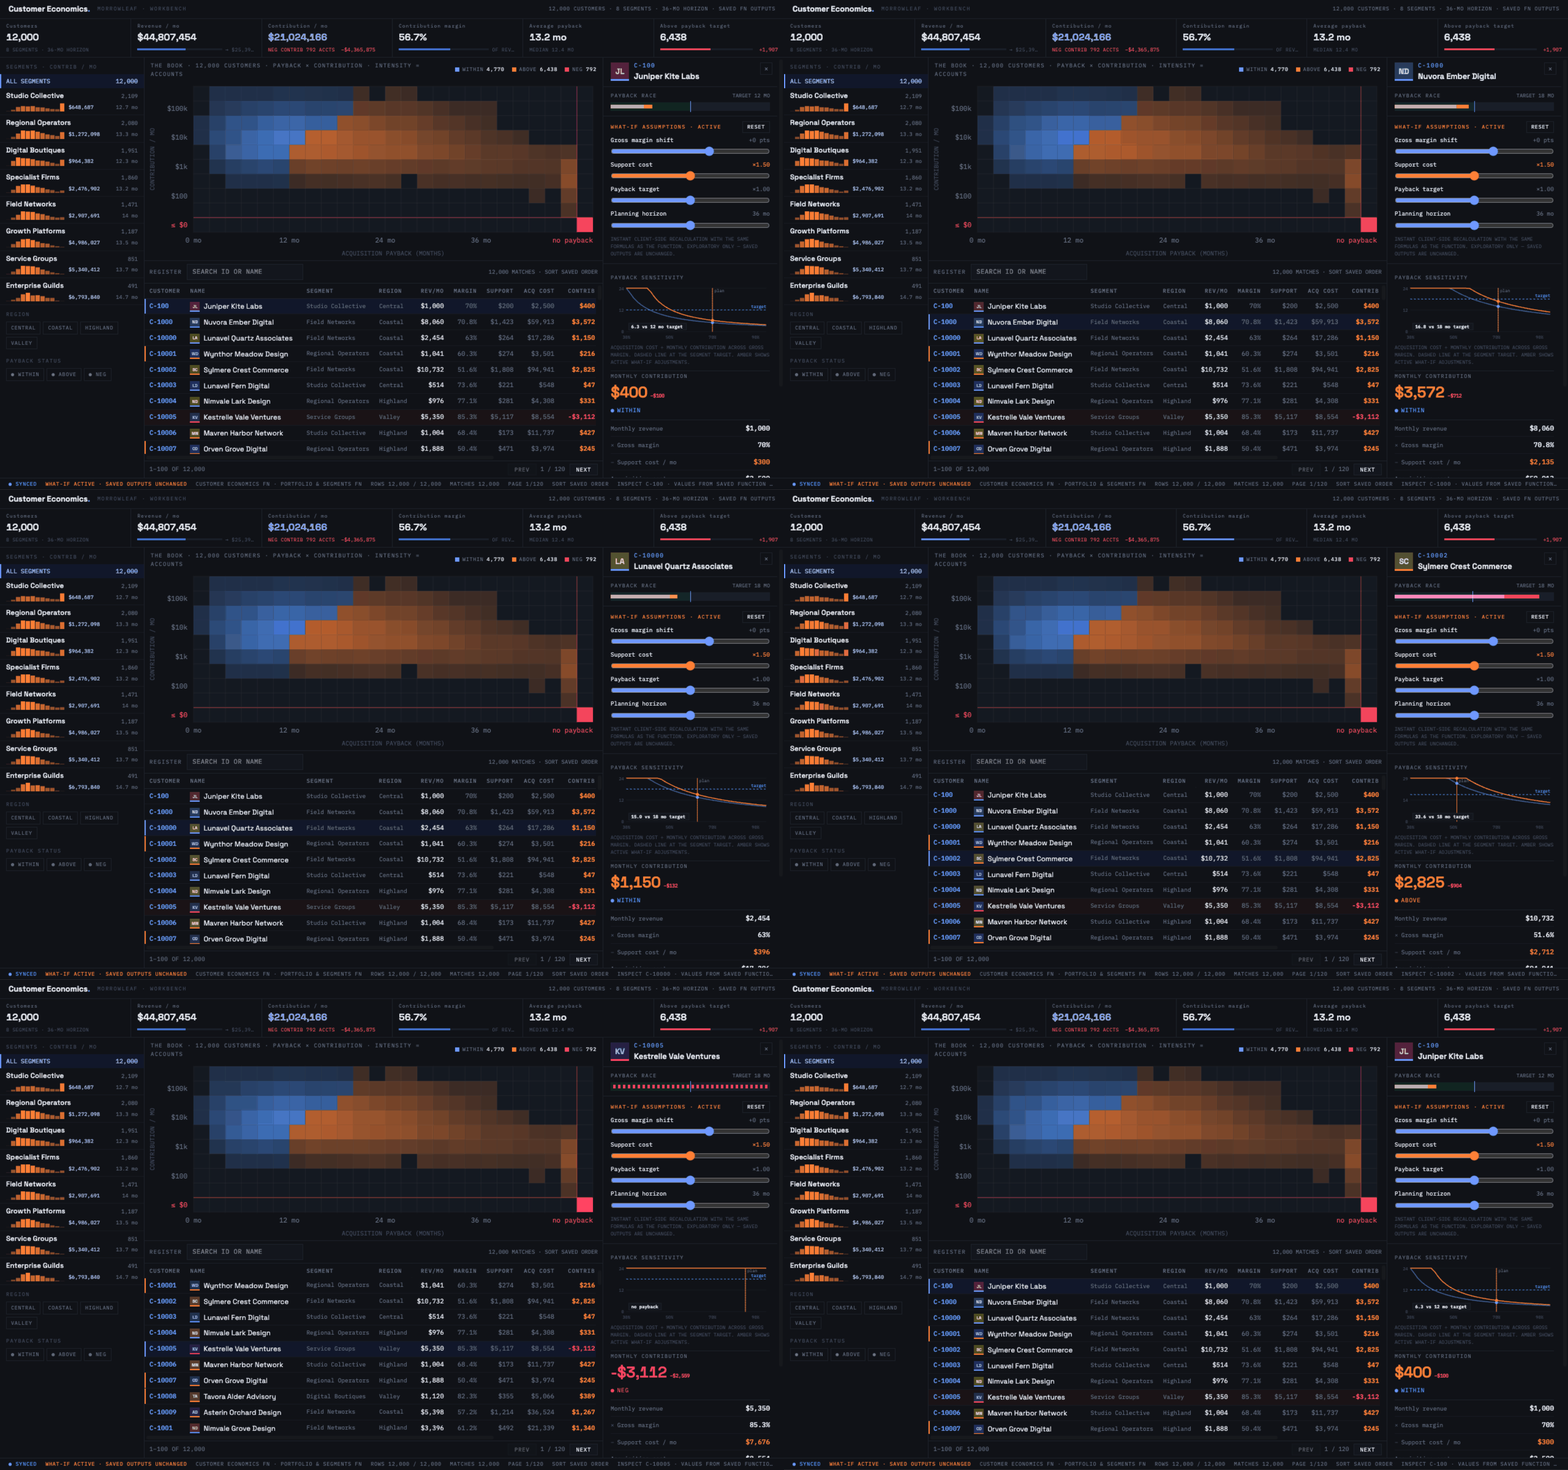
Select a customer to see the contribution breakdown and payback curve. Compare the plan with the what-if result and the segment target to understand what changed.
Compare customers' contribution and payback with support cost held at 1.5× plan.
4
Ask a follow-up question
In Application Studio, ask the agent to explain the result or revise the app to explore your next question. The preview stays beside the conversation.
Explore the customer economics app with the agent in Application Studio.
Every value along the way can be explained. In Application Studio, Show calculations outlines every value an app computed. Inspect one to see its equation, its operands, and the saved function it came from.
Compute capex
Customer economics
Show calculations turns on: every value the app computed is outlined. Right-click one to trace its equation and inputs.
Show calculations turns on: every value the app computed is outlined. Right-click one to trace its equation and inputs.
Apps take action as well as show information. Depending on what it was built for, an app can update a record, assign an account, approve a change, or record a decision, and that change flows back into the data every other app reads.
The calculations behind an app are functions: saved business logic that runs over the ontology, Cord’s model of your business data, and stores its results. Two apps built on the same function show the same definition of contribution or payback. Each build reads specific saved results, so the version and inputs behind any number are always known.
Because an agent builds apps, each team gets software shaped to how it works rather than one dashboard for everyone. The capacity investment app above reads a site break-even function. That same function could feed three more:
App
Who uses it
What it covers
Capital plan
FP&A and the investment committee
Every proposed project with its spend, expected return, payback, and ROIC, ranked against the hurdle rate; scenarios on cost of capital and timing; approve, defer, or send back with a note
Asset economics
Operations and plant finance
Each site, line, or fleet with contribution, utilization, maintenance capex against return, and the assets falling below their target; drill from a site to the orders and costs behind it
Sources and uses
Corporate development
Acquisition targets with pro forma economics, synergy cases, financing mix, and a board-ready view; every figure traceable to the model and the source records
Break-even is defined once, in that function, so the committee, the plant, and the deal team are looking at the same number. New apps reuse what exists and add what they need.