> ## Documentation Index
> Fetch the complete documentation index at: https://docs.cord.nyc/llms.txt
> Use this file to discover all available pages before exploring further.

> ## Agent Instructions
> You are helping someone use Cord, the capital and resource allocation platform.
> Use title-case Cord in prose. Prefer workspace, project, ontology, lineage, scenario, and allocation.
> Say source-backed or sourced for answers with lineage. Do not say hallucination-free.
> Product URLs are https://app.cord.nyc, https://cord.nyc, and https://trust.cord.nyc. Support is support@cord.nyc.
> Give concrete product steps. Do not invent UI labels, CLI commands, or unreleased agent runtime details.
> Use Understanding Cord for concepts and Guides for task steps.

# Functions

> Saved business logic, written by an agent, shared by every app.

export const FunctionExampleCompute = () => <div>
<svg className="block dark:hidden" viewBox="-1 -1 514 360" width="100%" style={{
  maxWidth: "514px",
  margin: "1.25rem auto"
}} xmlns="http://www.w3.org/2000/svg" role="img">
<defs><marker id="arrow-function-example-compute-light" viewBox="0 0 10 10" refX="9" refY="5" markerWidth="8" markerHeight="8" orient="auto-start-reverse"><path d="M 0 0 L 10 5 L 0 10 z" fill="#8fa7cb" /></marker></defs>
<path d="M 80.0 64 C 80.0 82.0, 228.0 78.0, 228.0 96" fill="none" stroke="#8fa7cb" strokeWidth="1.5" markerEnd="url(#arrow-function-example-compute-light)" />
<path d="M 256.0 64 L 256.0 96" fill="none" stroke="#8fa7cb" strokeWidth="1.5" markerEnd="url(#arrow-function-example-compute-light)" />
<path d="M 432.0 64 C 432.0 82.0, 284.0 78.0, 284.0 96" fill="none" stroke="#8fa7cb" strokeWidth="1.5" markerEnd="url(#arrow-function-example-compute-light)" />
<path d="M 256.0 162 C 256.0 179.0, 118.0 179.0, 118.0 194" fill="none" stroke="#8fa7cb" strokeWidth="1.5" markerEnd="url(#arrow-function-example-compute-light)" />
<path d="M 256.0 162 C 256.0 179.0, 394.0 179.0, 394.0 194" fill="none" stroke="#8fa7cb" strokeWidth="1.5" markerEnd="url(#arrow-function-example-compute-light)" />
<path d="M 394.0 260 L 394.0 292" fill="none" stroke="#8fa7cb" strokeWidth="1.5" markerEnd="url(#arrow-function-example-compute-light)" />
<rect x="0" y="0" width="160" height="64" rx="8" fill="#f6f8fb" stroke="#d3dbe7" strokeWidth="1" />
<text x="80.0" y="27.0" textAnchor="middle" fontSize="15" fontWeight="500" fill="#111111">Data Center object</text>
<text x="80.0" y="46.0" textAnchor="middle" fontSize="12.5" fill="#5b6472">GPUs, capex</text>
<rect x="176" y="0" width="160" height="64" rx="8" fill="#f6f8fb" stroke="#d3dbe7" strokeWidth="1" />
<text x="256.0" y="27.0" textAnchor="middle" fontSize="15" fontWeight="500" fill="#111111">Power Tariff object</text>
<text x="256.0" y="46.0" textAnchor="middle" fontSize="12.5" fill="#5b6472">energy rate</text>
<rect x="352" y="0" width="160" height="64" rx="8" fill="#f6f8fb" stroke="#d3dbe7" strokeWidth="1" />
<text x="432.0" y="27.0" textAnchor="middle" fontSize="15" fontWeight="500" fill="#111111">Scenario object</text>
<text x="432.0" y="46.0" textAnchor="middle" fontSize="12.5" fill="#5b6472">utilization, price, r</text>
<rect x="138.0" y="98" width="236" height="64" rx="8" fill="#4a6fa5" stroke="#4a6fa5" strokeWidth="1" />
<text x="256.0" y="125.0" textAnchor="middle" fontSize="15" fontWeight="500" fill="#ffffff">Site break-even</text>
<text x="256.0" y="144.0" textAnchor="middle" fontSize="12.5" fill="#dfe7f3">operating and economic profit</text>
<rect x="0" y="196" width="236" height="64" rx="8" fill="#f6f8fb" stroke="#d3dbe7" strokeWidth="1" />
<text x="118.0" y="223.0" textAnchor="middle" fontSize="15" fontWeight="500" fill="#111111">Site comparison</text>
<text x="118.0" y="242.0" textAnchor="middle" fontSize="12.5" fill="#5b6472">in the app</text>
<rect x="276" y="196" width="236" height="64" rx="8" fill="#f6f8fb" stroke="#d3dbe7" strokeWidth="1" />
<text x="394.0" y="223.0" textAnchor="middle" fontSize="15" fontWeight="500" fill="#111111">Portfolio investment</text>
<text x="394.0" y="242.0" textAnchor="middle" fontSize="12.5" fill="#5b6472">totals by scenario</text>
<rect x="276" y="294" width="236" height="64" rx="8" fill="#f6f8fb" stroke="#d3dbe7" strokeWidth="1" />
<text x="394.0" y="321.0" textAnchor="middle" fontSize="15" fontWeight="500" fill="#111111">KPI tiles</text>
<text x="394.0" y="340.0" textAnchor="middle" fontSize="12.5" fill="#5b6472">in the app</text>
</svg>
<svg className="hidden dark:block" viewBox="-1 -1 514 360" width="100%" style={{
  maxWidth: "514px",
  margin: "1.25rem auto"
}} xmlns="http://www.w3.org/2000/svg" role="img">
<defs><marker id="arrow-function-example-compute-dark" viewBox="0 0 10 10" refX="9" refY="5" markerWidth="8" markerHeight="8" orient="auto-start-reverse"><path d="M 0 0 L 10 5 L 0 10 z" fill="#5f7ba8" /></marker></defs>
<path d="M 80.0 64 C 80.0 82.0, 228.0 78.0, 228.0 96" fill="none" stroke="#5f7ba8" strokeWidth="1.5" markerEnd="url(#arrow-function-example-compute-dark)" />
<path d="M 256.0 64 L 256.0 96" fill="none" stroke="#5f7ba8" strokeWidth="1.5" markerEnd="url(#arrow-function-example-compute-dark)" />
<path d="M 432.0 64 C 432.0 82.0, 284.0 78.0, 284.0 96" fill="none" stroke="#5f7ba8" strokeWidth="1.5" markerEnd="url(#arrow-function-example-compute-dark)" />
<path d="M 256.0 162 C 256.0 179.0, 118.0 179.0, 118.0 194" fill="none" stroke="#5f7ba8" strokeWidth="1.5" markerEnd="url(#arrow-function-example-compute-dark)" />
<path d="M 256.0 162 C 256.0 179.0, 394.0 179.0, 394.0 194" fill="none" stroke="#5f7ba8" strokeWidth="1.5" markerEnd="url(#arrow-function-example-compute-dark)" />
<path d="M 394.0 260 L 394.0 292" fill="none" stroke="#5f7ba8" strokeWidth="1.5" markerEnd="url(#arrow-function-example-compute-dark)" />
<rect x="0" y="0" width="160" height="64" rx="8" fill="#161b26" stroke="#2c3546" strokeWidth="1" />
<text x="80.0" y="27.0" textAnchor="middle" fontSize="15" fontWeight="500" fill="#e8eaef">Data Center object</text>
<text x="80.0" y="46.0" textAnchor="middle" fontSize="12.5" fill="#9aa3b2">GPUs, capex</text>
<rect x="176" y="0" width="160" height="64" rx="8" fill="#161b26" stroke="#2c3546" strokeWidth="1" />
<text x="256.0" y="27.0" textAnchor="middle" fontSize="15" fontWeight="500" fill="#e8eaef">Power Tariff object</text>
<text x="256.0" y="46.0" textAnchor="middle" fontSize="12.5" fill="#9aa3b2">energy rate</text>
<rect x="352" y="0" width="160" height="64" rx="8" fill="#161b26" stroke="#2c3546" strokeWidth="1" />
<text x="432.0" y="27.0" textAnchor="middle" fontSize="15" fontWeight="500" fill="#e8eaef">Scenario object</text>
<text x="432.0" y="46.0" textAnchor="middle" fontSize="12.5" fill="#9aa3b2">utilization, price, r</text>
<rect x="138.0" y="98" width="236" height="64" rx="8" fill="#4a6fa5" stroke="#4a6fa5" strokeWidth="1" />
<text x="256.0" y="125.0" textAnchor="middle" fontSize="15" fontWeight="500" fill="#ffffff">Site break-even</text>
<text x="256.0" y="144.0" textAnchor="middle" fontSize="12.5" fill="#dfe7f3">operating and economic profit</text>
<rect x="0" y="196" width="236" height="64" rx="8" fill="#161b26" stroke="#2c3546" strokeWidth="1" />
<text x="118.0" y="223.0" textAnchor="middle" fontSize="15" fontWeight="500" fill="#e8eaef">Site comparison</text>
<text x="118.0" y="242.0" textAnchor="middle" fontSize="12.5" fill="#9aa3b2">in the app</text>
<rect x="276" y="196" width="236" height="64" rx="8" fill="#161b26" stroke="#2c3546" strokeWidth="1" />
<text x="394.0" y="223.0" textAnchor="middle" fontSize="15" fontWeight="500" fill="#e8eaef">Portfolio investment</text>
<text x="394.0" y="242.0" textAnchor="middle" fontSize="12.5" fill="#9aa3b2">totals by scenario</text>
<rect x="276" y="294" width="236" height="64" rx="8" fill="#161b26" stroke="#2c3546" strokeWidth="1" />
<text x="394.0" y="321.0" textAnchor="middle" fontSize="15" fontWeight="500" fill="#e8eaef">KPI tiles</text>
<text x="394.0" y="340.0" textAnchor="middle" fontSize="12.5" fill="#9aa3b2">in the app</text>
</svg>
  </div>;

export const FunctionExample = () => <div>
<svg className="block dark:hidden" viewBox="-1 -1 514 360" width="100%" style={{
  maxWidth: "514px",
  margin: "1.25rem auto"
}} xmlns="http://www.w3.org/2000/svg" role="img">
<defs><marker id="arrow-function-example-light" viewBox="0 0 10 10" refX="9" refY="5" markerWidth="8" markerHeight="8" orient="auto-start-reverse"><path d="M 0 0 L 10 5 L 0 10 z" fill="#8fa7cb" /></marker></defs>
<path d="M 80.0 64 C 80.0 82.0, 228.0 78.0, 228.0 96" fill="none" stroke="#8fa7cb" strokeWidth="1.5" markerEnd="url(#arrow-function-example-light)" />
<path d="M 256.0 64 L 256.0 96" fill="none" stroke="#8fa7cb" strokeWidth="1.5" markerEnd="url(#arrow-function-example-light)" />
<path d="M 432.0 64 C 432.0 82.0, 284.0 78.0, 284.0 96" fill="none" stroke="#8fa7cb" strokeWidth="1.5" markerEnd="url(#arrow-function-example-light)" />
<path d="M 256.0 162 C 256.0 179.0, 118.0 179.0, 118.0 194" fill="none" stroke="#8fa7cb" strokeWidth="1.5" markerEnd="url(#arrow-function-example-light)" />
<path d="M 256.0 162 C 256.0 179.0, 394.0 179.0, 394.0 194" fill="none" stroke="#8fa7cb" strokeWidth="1.5" markerEnd="url(#arrow-function-example-light)" />
<path d="M 394.0 260 L 394.0 292" fill="none" stroke="#8fa7cb" strokeWidth="1.5" markerEnd="url(#arrow-function-example-light)" />
<rect x="0" y="0" width="160" height="64" rx="8" fill="#f6f8fb" stroke="#d3dbe7" strokeWidth="1" />
<text x="80.0" y="27.0" textAnchor="middle" fontSize="15" fontWeight="500" fill="#111111">Customer object</text>
<text x="80.0" y="46.0" textAnchor="middle" fontSize="12.5" fill="#5b6472">revenue, margin, costs</text>
<rect x="176" y="0" width="160" height="64" rx="8" fill="#f6f8fb" stroke="#d3dbe7" strokeWidth="1" />
<text x="256.0" y="27.0" textAnchor="middle" fontSize="15" fontWeight="500" fill="#111111">Segment object</text>
<text x="256.0" y="46.0" textAnchor="middle" fontSize="12.5" fill="#5b6472">target, account cost</text>
<rect x="352" y="0" width="160" height="64" rx="8" fill="#f6f8fb" stroke="#d3dbe7" strokeWidth="1" />
<text x="432.0" y="27.0" textAnchor="middle" fontSize="15" fontWeight="500" fill="#111111">Product object</text>
<text x="432.0" y="46.0" textAnchor="middle" fontSize="12.5" fill="#5b6472">platform cost</text>
<rect x="138.0" y="98" width="236" height="64" rx="8" fill="#4a6fa5" stroke="#4a6fa5" strokeWidth="1" />
<text x="256.0" y="125.0" textAnchor="middle" fontSize="15" fontWeight="500" fill="#ffffff">Customer economics</text>
<text x="256.0" y="144.0" textAnchor="middle" fontSize="12.5" fill="#dfe7f3">contribution and payback</text>
<rect x="0" y="196" width="236" height="64" rx="8" fill="#f6f8fb" stroke="#d3dbe7" strokeWidth="1" />
<text x="118.0" y="223.0" textAnchor="middle" fontSize="15" fontWeight="500" fill="#111111">Customer table</text>
<text x="118.0" y="242.0" textAnchor="middle" fontSize="12.5" fill="#5b6472">in the app</text>
<rect x="276" y="196" width="236" height="64" rx="8" fill="#f6f8fb" stroke="#d3dbe7" strokeWidth="1" />
<text x="394.0" y="223.0" textAnchor="middle" fontSize="15" fontWeight="500" fill="#111111">Portfolio and segments</text>
<text x="394.0" y="242.0" textAnchor="middle" fontSize="12.5" fill="#5b6472">totals and averages</text>
<rect x="276" y="294" width="236" height="64" rx="8" fill="#f6f8fb" stroke="#d3dbe7" strokeWidth="1" />
<text x="394.0" y="321.0" textAnchor="middle" fontSize="15" fontWeight="500" fill="#111111">KPI tiles</text>
<text x="394.0" y="340.0" textAnchor="middle" fontSize="12.5" fill="#5b6472">in the app</text>
</svg>
<svg className="hidden dark:block" viewBox="-1 -1 514 360" width="100%" style={{
  maxWidth: "514px",
  margin: "1.25rem auto"
}} xmlns="http://www.w3.org/2000/svg" role="img">
<defs><marker id="arrow-function-example-dark" viewBox="0 0 10 10" refX="9" refY="5" markerWidth="8" markerHeight="8" orient="auto-start-reverse"><path d="M 0 0 L 10 5 L 0 10 z" fill="#5f7ba8" /></marker></defs>
<path d="M 80.0 64 C 80.0 82.0, 228.0 78.0, 228.0 96" fill="none" stroke="#5f7ba8" strokeWidth="1.5" markerEnd="url(#arrow-function-example-dark)" />
<path d="M 256.0 64 L 256.0 96" fill="none" stroke="#5f7ba8" strokeWidth="1.5" markerEnd="url(#arrow-function-example-dark)" />
<path d="M 432.0 64 C 432.0 82.0, 284.0 78.0, 284.0 96" fill="none" stroke="#5f7ba8" strokeWidth="1.5" markerEnd="url(#arrow-function-example-dark)" />
<path d="M 256.0 162 C 256.0 179.0, 118.0 179.0, 118.0 194" fill="none" stroke="#5f7ba8" strokeWidth="1.5" markerEnd="url(#arrow-function-example-dark)" />
<path d="M 256.0 162 C 256.0 179.0, 394.0 179.0, 394.0 194" fill="none" stroke="#5f7ba8" strokeWidth="1.5" markerEnd="url(#arrow-function-example-dark)" />
<path d="M 394.0 260 L 394.0 292" fill="none" stroke="#5f7ba8" strokeWidth="1.5" markerEnd="url(#arrow-function-example-dark)" />
<rect x="0" y="0" width="160" height="64" rx="8" fill="#161b26" stroke="#2c3546" strokeWidth="1" />
<text x="80.0" y="27.0" textAnchor="middle" fontSize="15" fontWeight="500" fill="#e8eaef">Customer object</text>
<text x="80.0" y="46.0" textAnchor="middle" fontSize="12.5" fill="#9aa3b2">revenue, margin, costs</text>
<rect x="176" y="0" width="160" height="64" rx="8" fill="#161b26" stroke="#2c3546" strokeWidth="1" />
<text x="256.0" y="27.0" textAnchor="middle" fontSize="15" fontWeight="500" fill="#e8eaef">Segment object</text>
<text x="256.0" y="46.0" textAnchor="middle" fontSize="12.5" fill="#9aa3b2">target, account cost</text>
<rect x="352" y="0" width="160" height="64" rx="8" fill="#161b26" stroke="#2c3546" strokeWidth="1" />
<text x="432.0" y="27.0" textAnchor="middle" fontSize="15" fontWeight="500" fill="#e8eaef">Product object</text>
<text x="432.0" y="46.0" textAnchor="middle" fontSize="12.5" fill="#9aa3b2">platform cost</text>
<rect x="138.0" y="98" width="236" height="64" rx="8" fill="#4a6fa5" stroke="#4a6fa5" strokeWidth="1" />
<text x="256.0" y="125.0" textAnchor="middle" fontSize="15" fontWeight="500" fill="#ffffff">Customer economics</text>
<text x="256.0" y="144.0" textAnchor="middle" fontSize="12.5" fill="#dfe7f3">contribution and payback</text>
<rect x="0" y="196" width="236" height="64" rx="8" fill="#161b26" stroke="#2c3546" strokeWidth="1" />
<text x="118.0" y="223.0" textAnchor="middle" fontSize="15" fontWeight="500" fill="#e8eaef">Customer table</text>
<text x="118.0" y="242.0" textAnchor="middle" fontSize="12.5" fill="#9aa3b2">in the app</text>
<rect x="276" y="196" width="236" height="64" rx="8" fill="#161b26" stroke="#2c3546" strokeWidth="1" />
<text x="394.0" y="223.0" textAnchor="middle" fontSize="15" fontWeight="500" fill="#e8eaef">Portfolio and segments</text>
<text x="394.0" y="242.0" textAnchor="middle" fontSize="12.5" fill="#9aa3b2">totals and averages</text>
<rect x="276" y="294" width="236" height="64" rx="8" fill="#161b26" stroke="#2c3546" strokeWidth="1" />
<text x="394.0" y="321.0" textAnchor="middle" fontSize="15" fontWeight="500" fill="#e8eaef">KPI tiles</text>
<text x="394.0" y="340.0" textAnchor="middle" fontSize="12.5" fill="#9aa3b2">in the app</text>
</svg>
  </div>;

export const FunctionParts = () => <div>
<svg className="block dark:hidden" viewBox="-1 -1 514 262" width="100%" style={{
  maxWidth: "514px",
  margin: "1.25rem auto"
}} xmlns="http://www.w3.org/2000/svg" role="img">
<defs><marker id="arrow-function-parts-light" viewBox="0 0 10 10" refX="9" refY="5" markerWidth="8" markerHeight="8" orient="auto-start-reverse"><path d="M 0 0 L 10 5 L 0 10 z" fill="#8fa7cb" /></marker></defs>
<path d="M 118.0 64 C 118.0 81.0, 256.0 81.0, 256.0 96" fill="none" stroke="#8fa7cb" strokeWidth="1.5" markerEnd="url(#arrow-function-parts-light)" />
<path d="M 394.0 64 C 394.0 81.0, 256.0 81.0, 256.0 96" fill="none" stroke="#8fa7cb" strokeWidth="1.5" markerEnd="url(#arrow-function-parts-light)" />
<path d="M 256.0 162 C 256.0 179.0, 118.0 179.0, 118.0 194" fill="none" stroke="#8fa7cb" strokeWidth="1.5" markerEnd="url(#arrow-function-parts-light)" />
<path d="M 256.0 162 C 256.0 179.0, 394.0 179.0, 394.0 194" fill="none" stroke="#8fa7cb" strokeWidth="1.5" markerEnd="url(#arrow-function-parts-light)" />
<rect x="0" y="0" width="236" height="64" rx="8" fill="#f6f8fb" stroke="#d3dbe7" strokeWidth="1" />
<text x="118.0" y="27.0" textAnchor="middle" fontSize="15" fontWeight="500" fill="#111111">Definition</text>
<text x="118.0" y="46.0" textAnchor="middle" fontSize="12.5" fill="#5b6472">the SQL, versioned</text>
<rect x="276" y="0" width="236" height="64" rx="8" fill="#f6f8fb" stroke="#d3dbe7" strokeWidth="1" />
<text x="394.0" y="27.0" textAnchor="middle" fontSize="15" fontWeight="500" fill="#111111">Data setup</text>
<text x="394.0" y="46.0" textAnchor="middle" fontSize="12.5" fill="#5b6472">tables and assumptions</text>
<rect x="138.0" y="98" width="236" height="64" rx="8" fill="#4a6fa5" stroke="#4a6fa5" strokeWidth="1" />
<text x="256.0" y="125.0" textAnchor="middle" fontSize="15" fontWeight="500" fill="#ffffff">Run</text>
<text x="256.0" y="144.0" textAnchor="middle" fontSize="12.5" fill="#dfe7f3">saved output table</text>
<rect x="0" y="196" width="236" height="64" rx="8" fill="#f6f8fb" stroke="#d3dbe7" strokeWidth="1" />
<text x="118.0" y="223.0" textAnchor="middle" fontSize="15" fontWeight="500" fill="#111111">App</text>
<text x="118.0" y="242.0" textAnchor="middle" fontSize="12.5" fill="#5b6472">reads the run</text>
<rect x="276" y="196" width="236" height="64" rx="8" fill="#f6f8fb" stroke="#d3dbe7" strokeWidth="1" />
<text x="394.0" y="223.0" textAnchor="middle" fontSize="15" fontWeight="500" fill="#111111">Another function</text>
<text x="394.0" y="242.0" textAnchor="middle" fontSize="12.5" fill="#5b6472">reads the run</text>
</svg>
<svg className="hidden dark:block" viewBox="-1 -1 514 262" width="100%" style={{
  maxWidth: "514px",
  margin: "1.25rem auto"
}} xmlns="http://www.w3.org/2000/svg" role="img">
<defs><marker id="arrow-function-parts-dark" viewBox="0 0 10 10" refX="9" refY="5" markerWidth="8" markerHeight="8" orient="auto-start-reverse"><path d="M 0 0 L 10 5 L 0 10 z" fill="#5f7ba8" /></marker></defs>
<path d="M 118.0 64 C 118.0 81.0, 256.0 81.0, 256.0 96" fill="none" stroke="#5f7ba8" strokeWidth="1.5" markerEnd="url(#arrow-function-parts-dark)" />
<path d="M 394.0 64 C 394.0 81.0, 256.0 81.0, 256.0 96" fill="none" stroke="#5f7ba8" strokeWidth="1.5" markerEnd="url(#arrow-function-parts-dark)" />
<path d="M 256.0 162 C 256.0 179.0, 118.0 179.0, 118.0 194" fill="none" stroke="#5f7ba8" strokeWidth="1.5" markerEnd="url(#arrow-function-parts-dark)" />
<path d="M 256.0 162 C 256.0 179.0, 394.0 179.0, 394.0 194" fill="none" stroke="#5f7ba8" strokeWidth="1.5" markerEnd="url(#arrow-function-parts-dark)" />
<rect x="0" y="0" width="236" height="64" rx="8" fill="#161b26" stroke="#2c3546" strokeWidth="1" />
<text x="118.0" y="27.0" textAnchor="middle" fontSize="15" fontWeight="500" fill="#e8eaef">Definition</text>
<text x="118.0" y="46.0" textAnchor="middle" fontSize="12.5" fill="#9aa3b2">the SQL, versioned</text>
<rect x="276" y="0" width="236" height="64" rx="8" fill="#161b26" stroke="#2c3546" strokeWidth="1" />
<text x="394.0" y="27.0" textAnchor="middle" fontSize="15" fontWeight="500" fill="#e8eaef">Data setup</text>
<text x="394.0" y="46.0" textAnchor="middle" fontSize="12.5" fill="#9aa3b2">tables and assumptions</text>
<rect x="138.0" y="98" width="236" height="64" rx="8" fill="#4a6fa5" stroke="#4a6fa5" strokeWidth="1" />
<text x="256.0" y="125.0" textAnchor="middle" fontSize="15" fontWeight="500" fill="#ffffff">Run</text>
<text x="256.0" y="144.0" textAnchor="middle" fontSize="12.5" fill="#dfe7f3">saved output table</text>
<rect x="0" y="196" width="236" height="64" rx="8" fill="#161b26" stroke="#2c3546" strokeWidth="1" />
<text x="118.0" y="223.0" textAnchor="middle" fontSize="15" fontWeight="500" fill="#e8eaef">App</text>
<text x="118.0" y="242.0" textAnchor="middle" fontSize="12.5" fill="#9aa3b2">reads the run</text>
<rect x="276" y="196" width="236" height="64" rx="8" fill="#161b26" stroke="#2c3546" strokeWidth="1" />
<text x="394.0" y="223.0" textAnchor="middle" fontSize="15" fontWeight="500" fill="#e8eaef">Another function</text>
<text x="394.0" y="242.0" textAnchor="middle" fontSize="12.5" fill="#9aa3b2">reads the run</text>
</svg>
  </div>;

export const UnderstandingFlow = ({active}) => {
  const stages = [{
    id: "ontology",
    label: "Ontology",
    detail: "business objects"
  }, {
    id: "functions",
    label: "Functions",
    detail: "shared calculations"
  }, {
    id: "apps",
    label: "Apps",
    detail: "operational interfaces"
  }];
  return <div style={{
    overflowX: "auto",
    margin: "1.5rem 0"
  }}>
      {["light", "dark"].map(theme => <svg key={theme} className={theme === "light" ? "block dark:hidden" : "hidden dark:block"} viewBox="-1 -1 778 66" width="100%" style={{
    minWidth: "540px",
    maxWidth: "778px",
    margin: "0 auto"
  }} xmlns="http://www.w3.org/2000/svg" role="img" aria-label={active ? `Ontology to Functions to Apps. ${stages.find(stage => stage.id === active).label} highlighted.` : "Ontology to Functions to Apps."}>
          {[236, 506].map(x => <g key={x} fill={theme === "light" ? "#8fa7cb" : "#5f7ba8"}>
              <path d={`M ${x} 32 H ${x + 25}`} stroke="currentColor" style={{
    color: theme === "light" ? "#8fa7cb" : "#5f7ba8"
  }} strokeWidth="1.5" />
              <path d={`M ${x + 24} 26 L ${x + 34} 32 L ${x + 24} 38 Z`} />
            </g>)}
          {stages.map((stage, index) => {
    const selected = stage.id === active;
    const light = theme === "light";
    return <g key={stage.id} transform={`translate(${index * 270} 0)`}>
                <rect width="236" height="64" rx="8" fill={selected ? "#4a6fa5" : light ? "#f6f8fb" : "#161b26"} stroke={selected ? "#4a6fa5" : light ? "#d3dbe7" : "#2c3546"} />
                <text x="118" y="27" textAnchor="middle" fontSize="15" fontWeight="500" fill={selected ? "#ffffff" : light ? "#111111" : "#e8eaef"}>{stage.label}</text>
                <text x="118" y="46" textAnchor="middle" fontSize="12.5" fill={selected ? "#dfe7f3" : light ? "#5b6472" : "#9aa3b2"}>{stage.detail}</text>
              </g>;
  })}
        </svg>)}
    </div>;
};

## What a function is

A function is a saved piece of business logic: how contribution is computed, how return on capital is measured, when a project counts as above its hurdle rate. It is written once, and every app that needs the number reads it from there.

A function has three parts.

| Part       | What it is                                                                                                                       |
| ---------- | -------------------------------------------------------------------------------------------------------------------------------- |
| Definition | The code that performs the calculation. Versioned, so every change is kept.                                                      |
| Data setup | What one use of the definition reads: which business objects, which upstream function outputs, and the value of each assumption. |
| Run        | One execution. Records the definition version and inputs used, and saves its output as a table that apps read.                   |

<FunctionParts />

## How a function gets written and managed

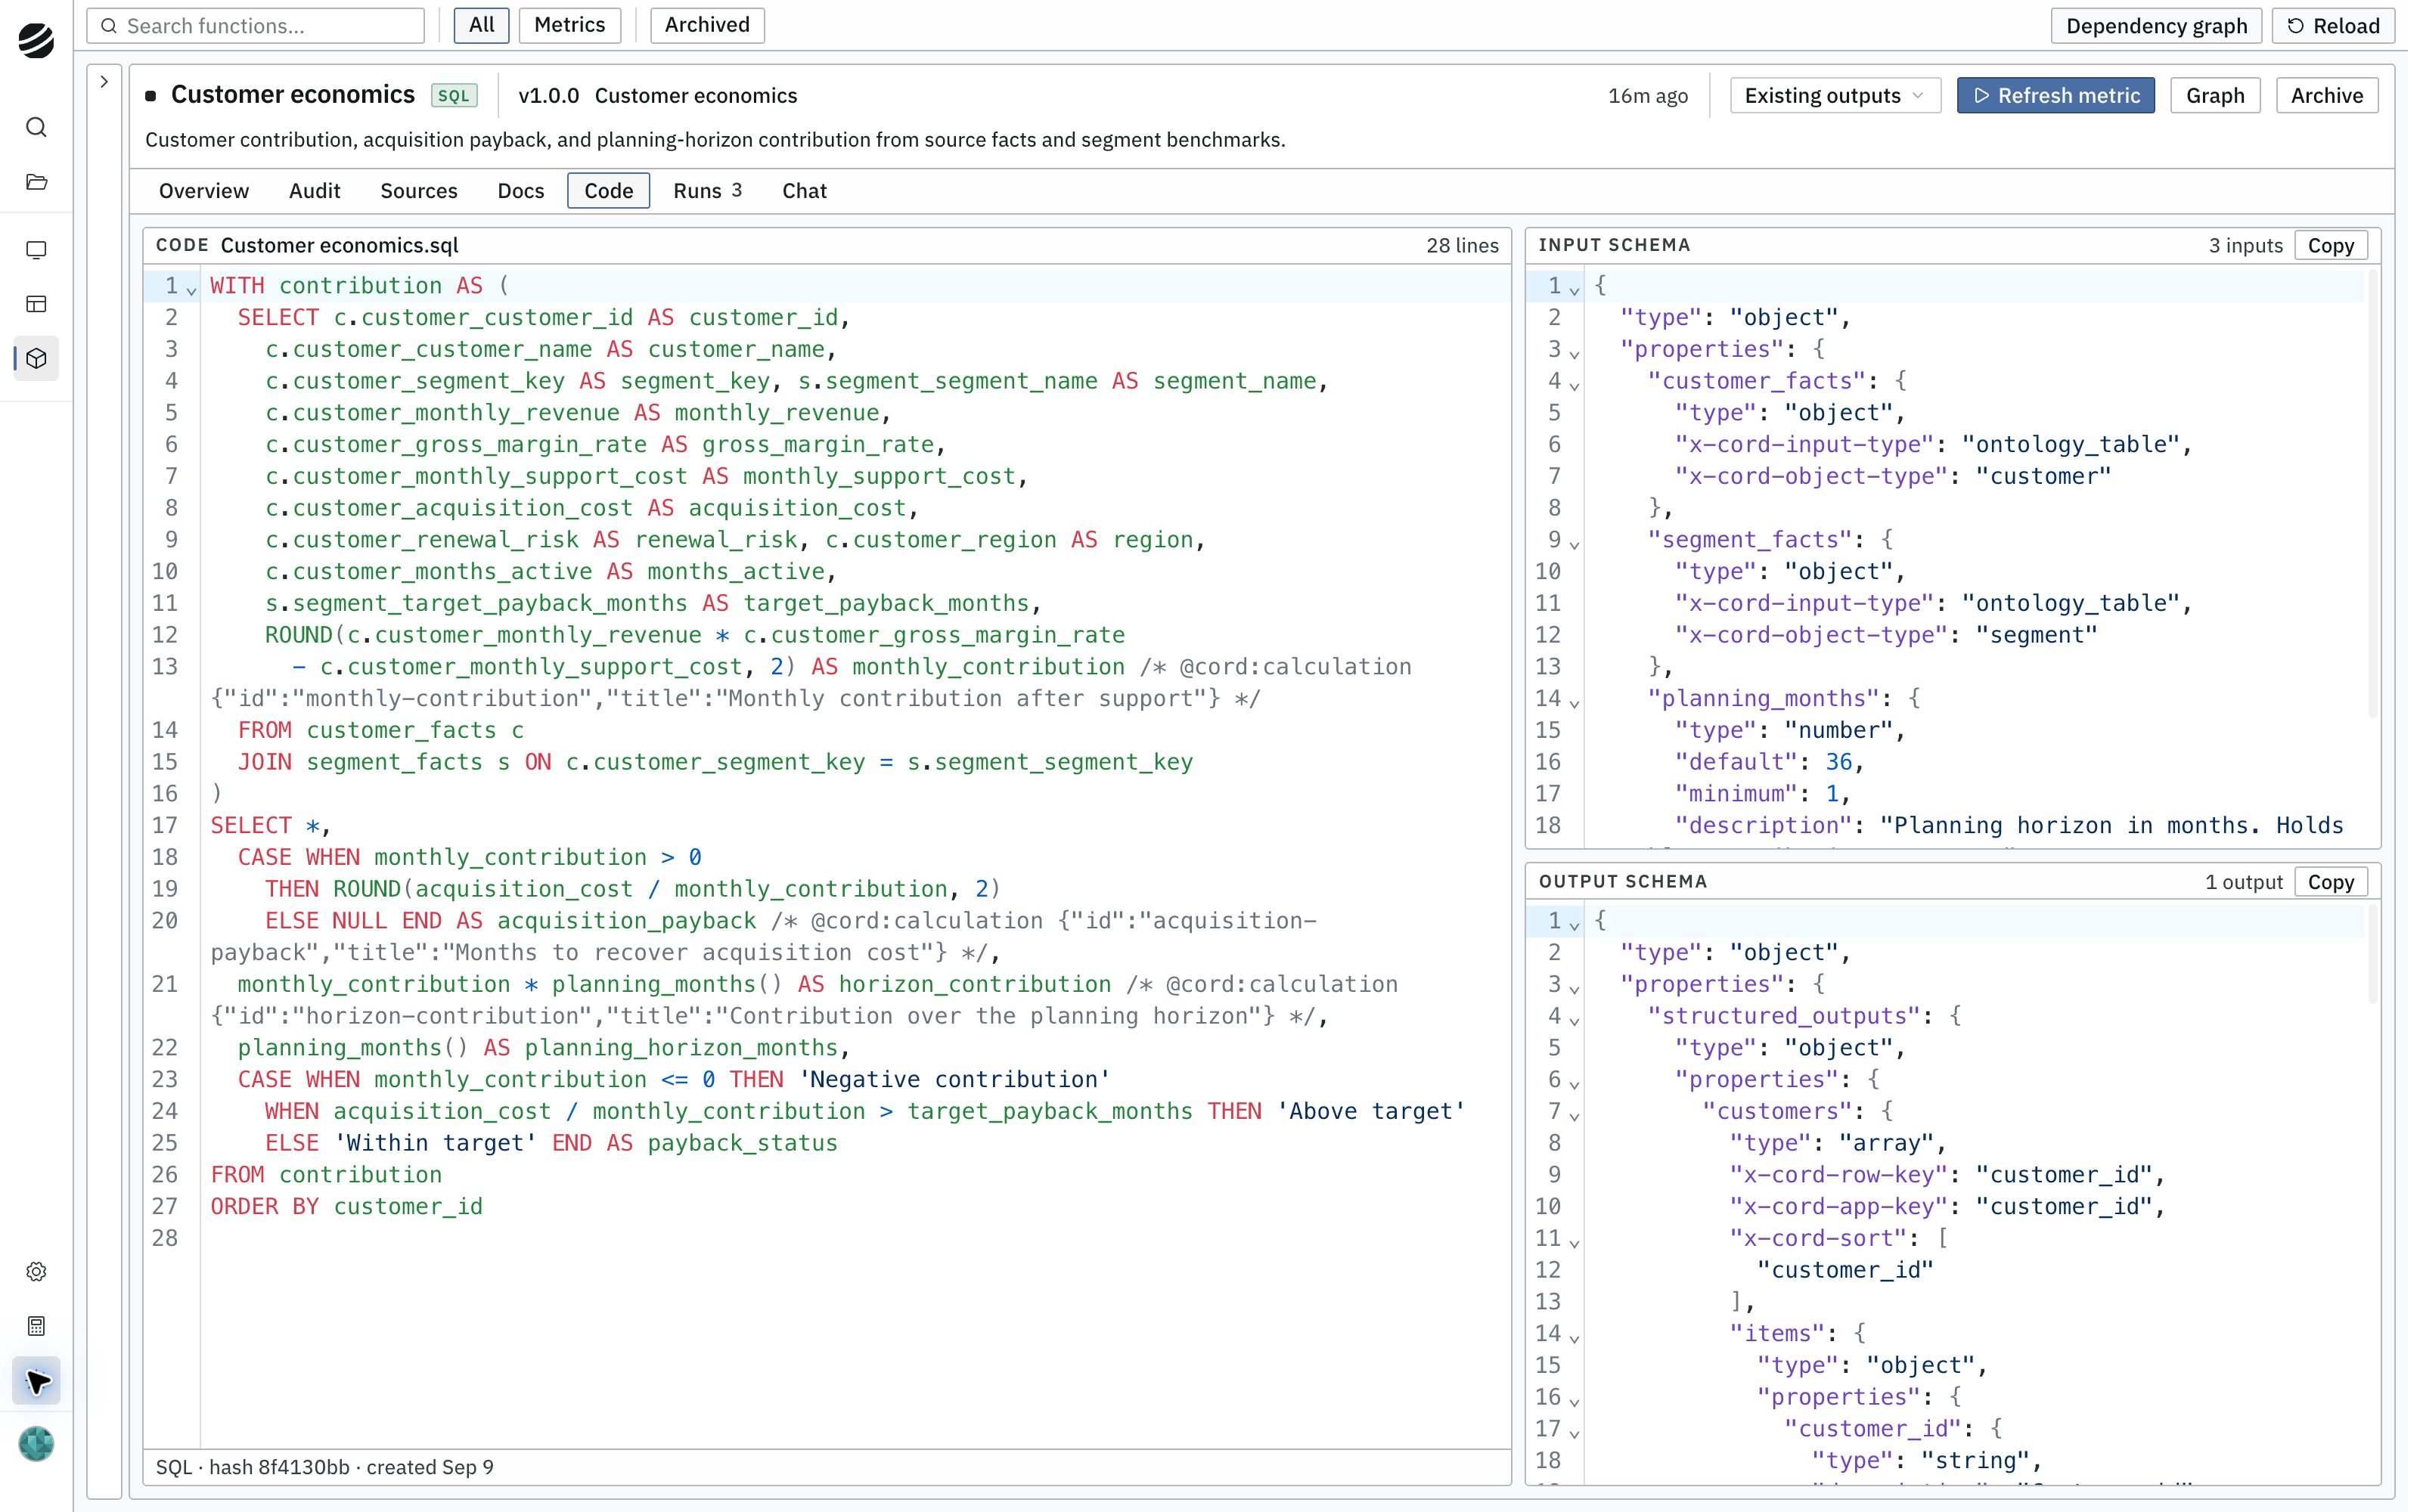
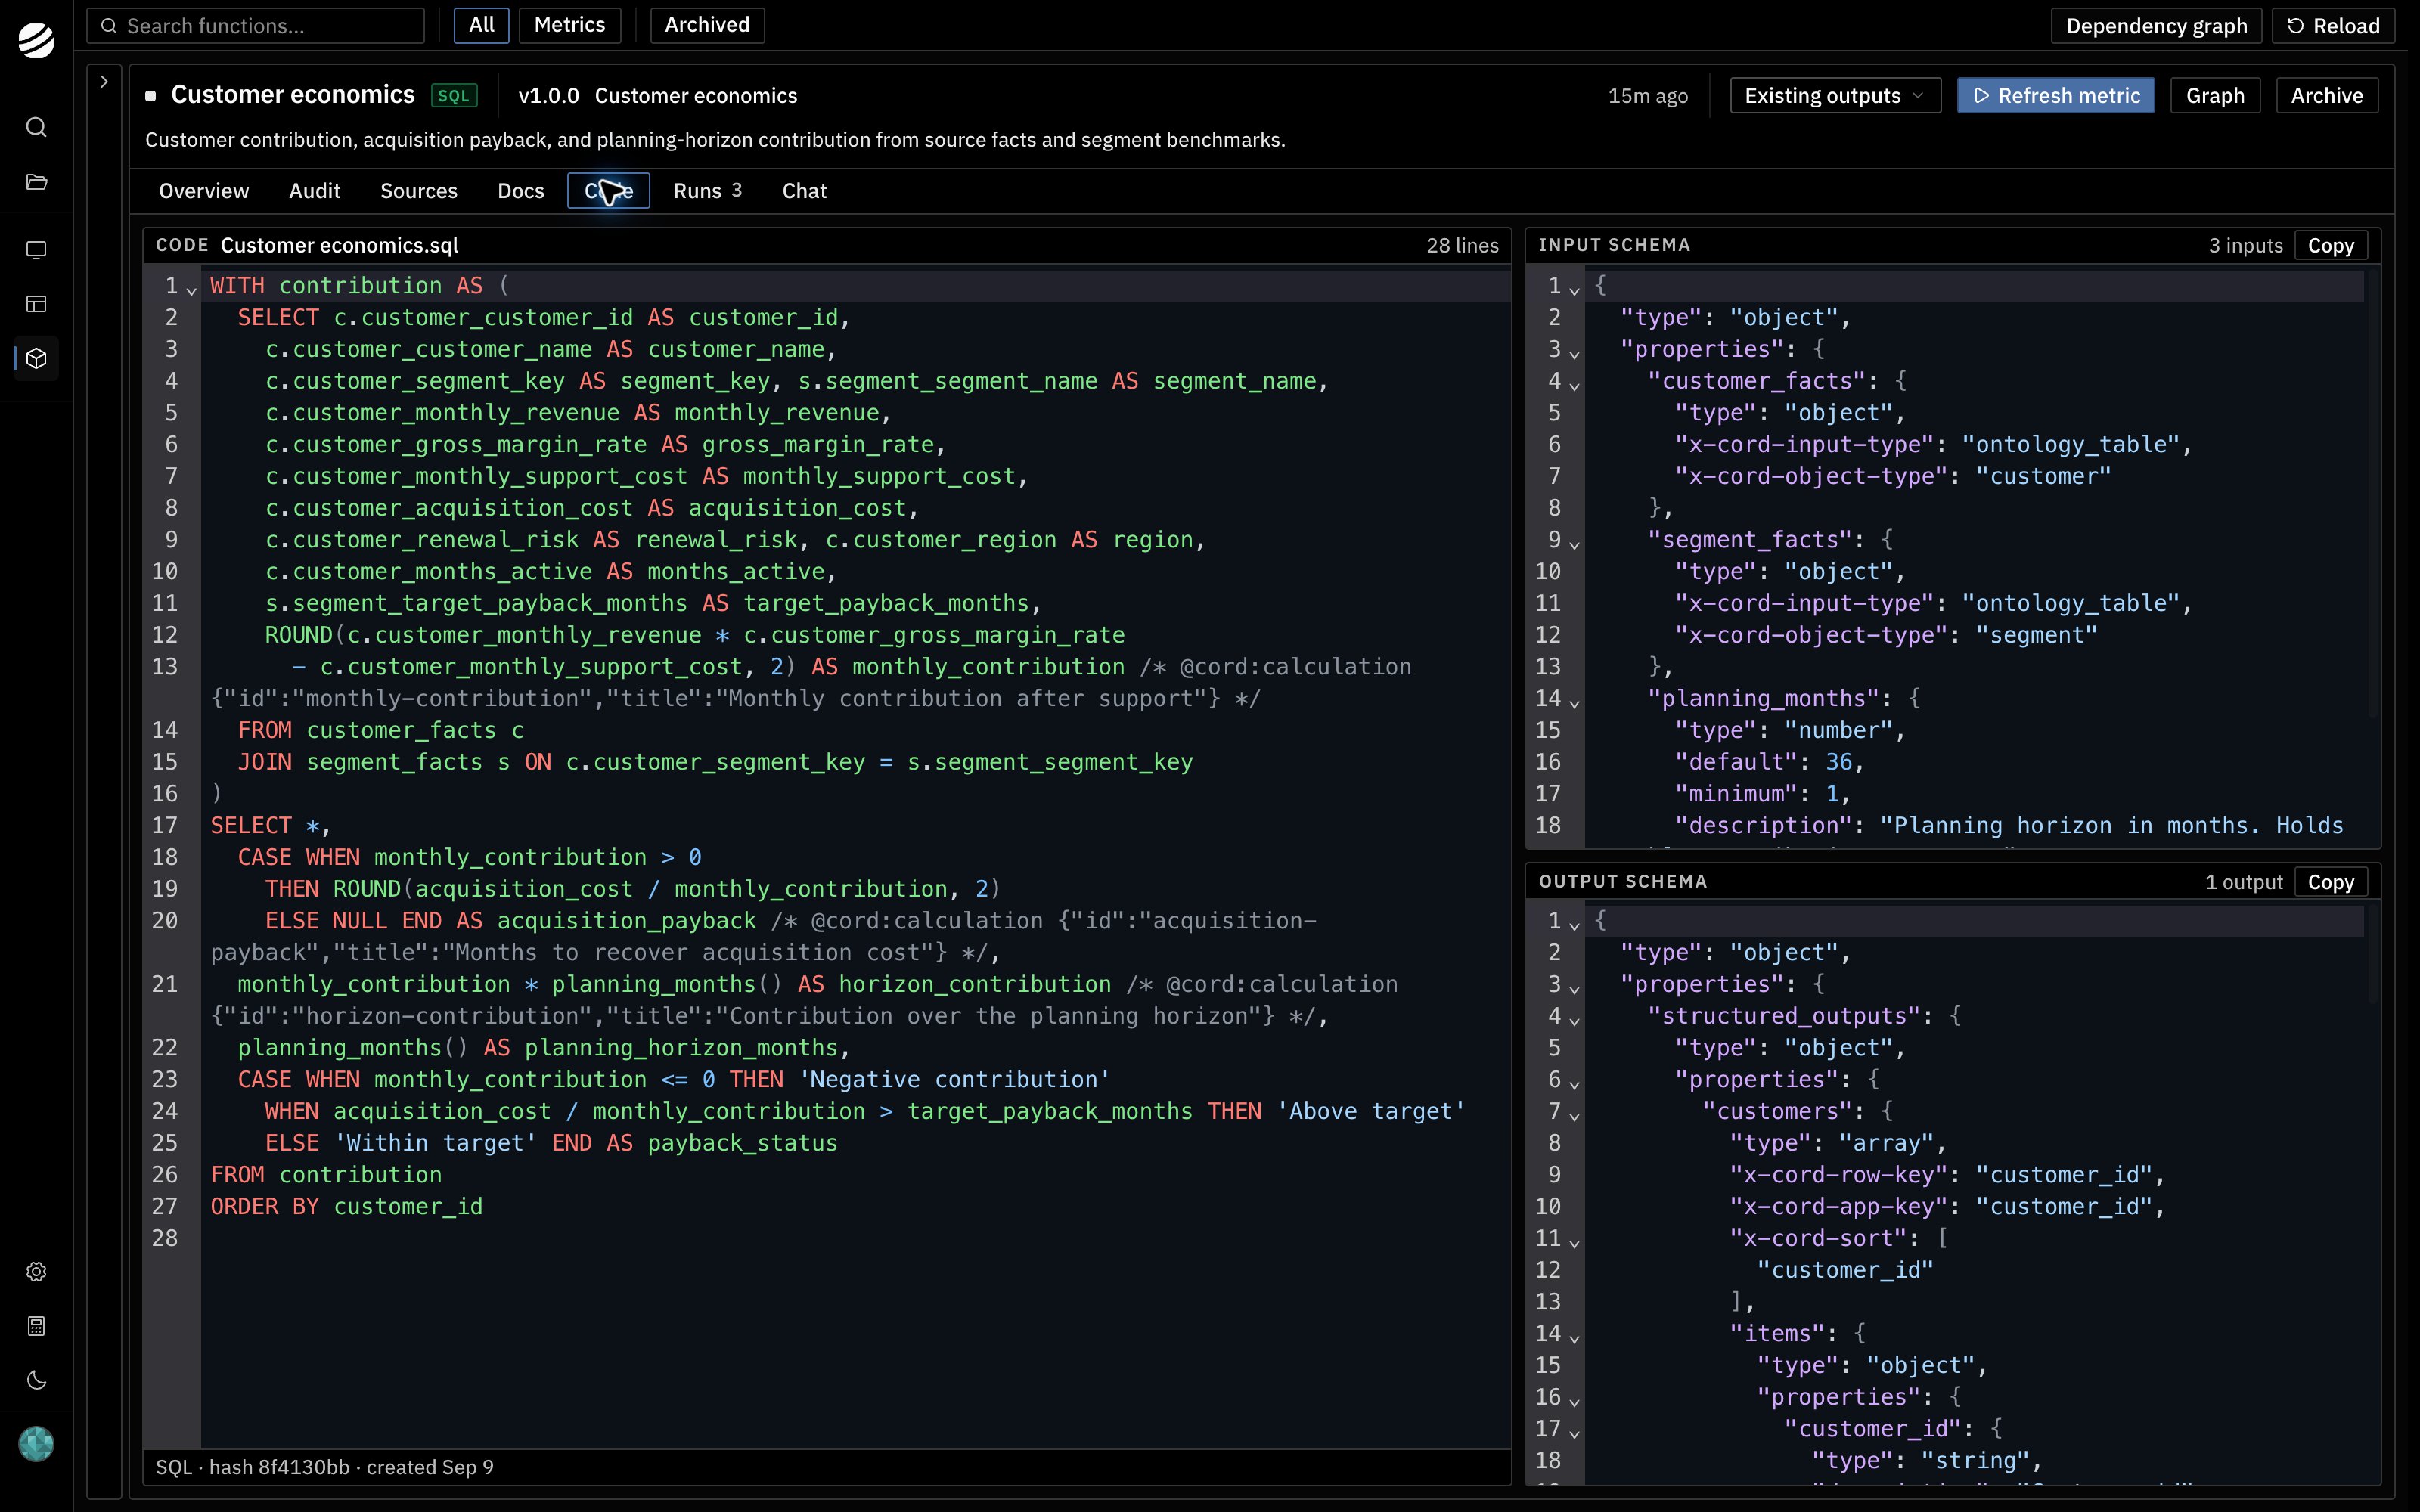
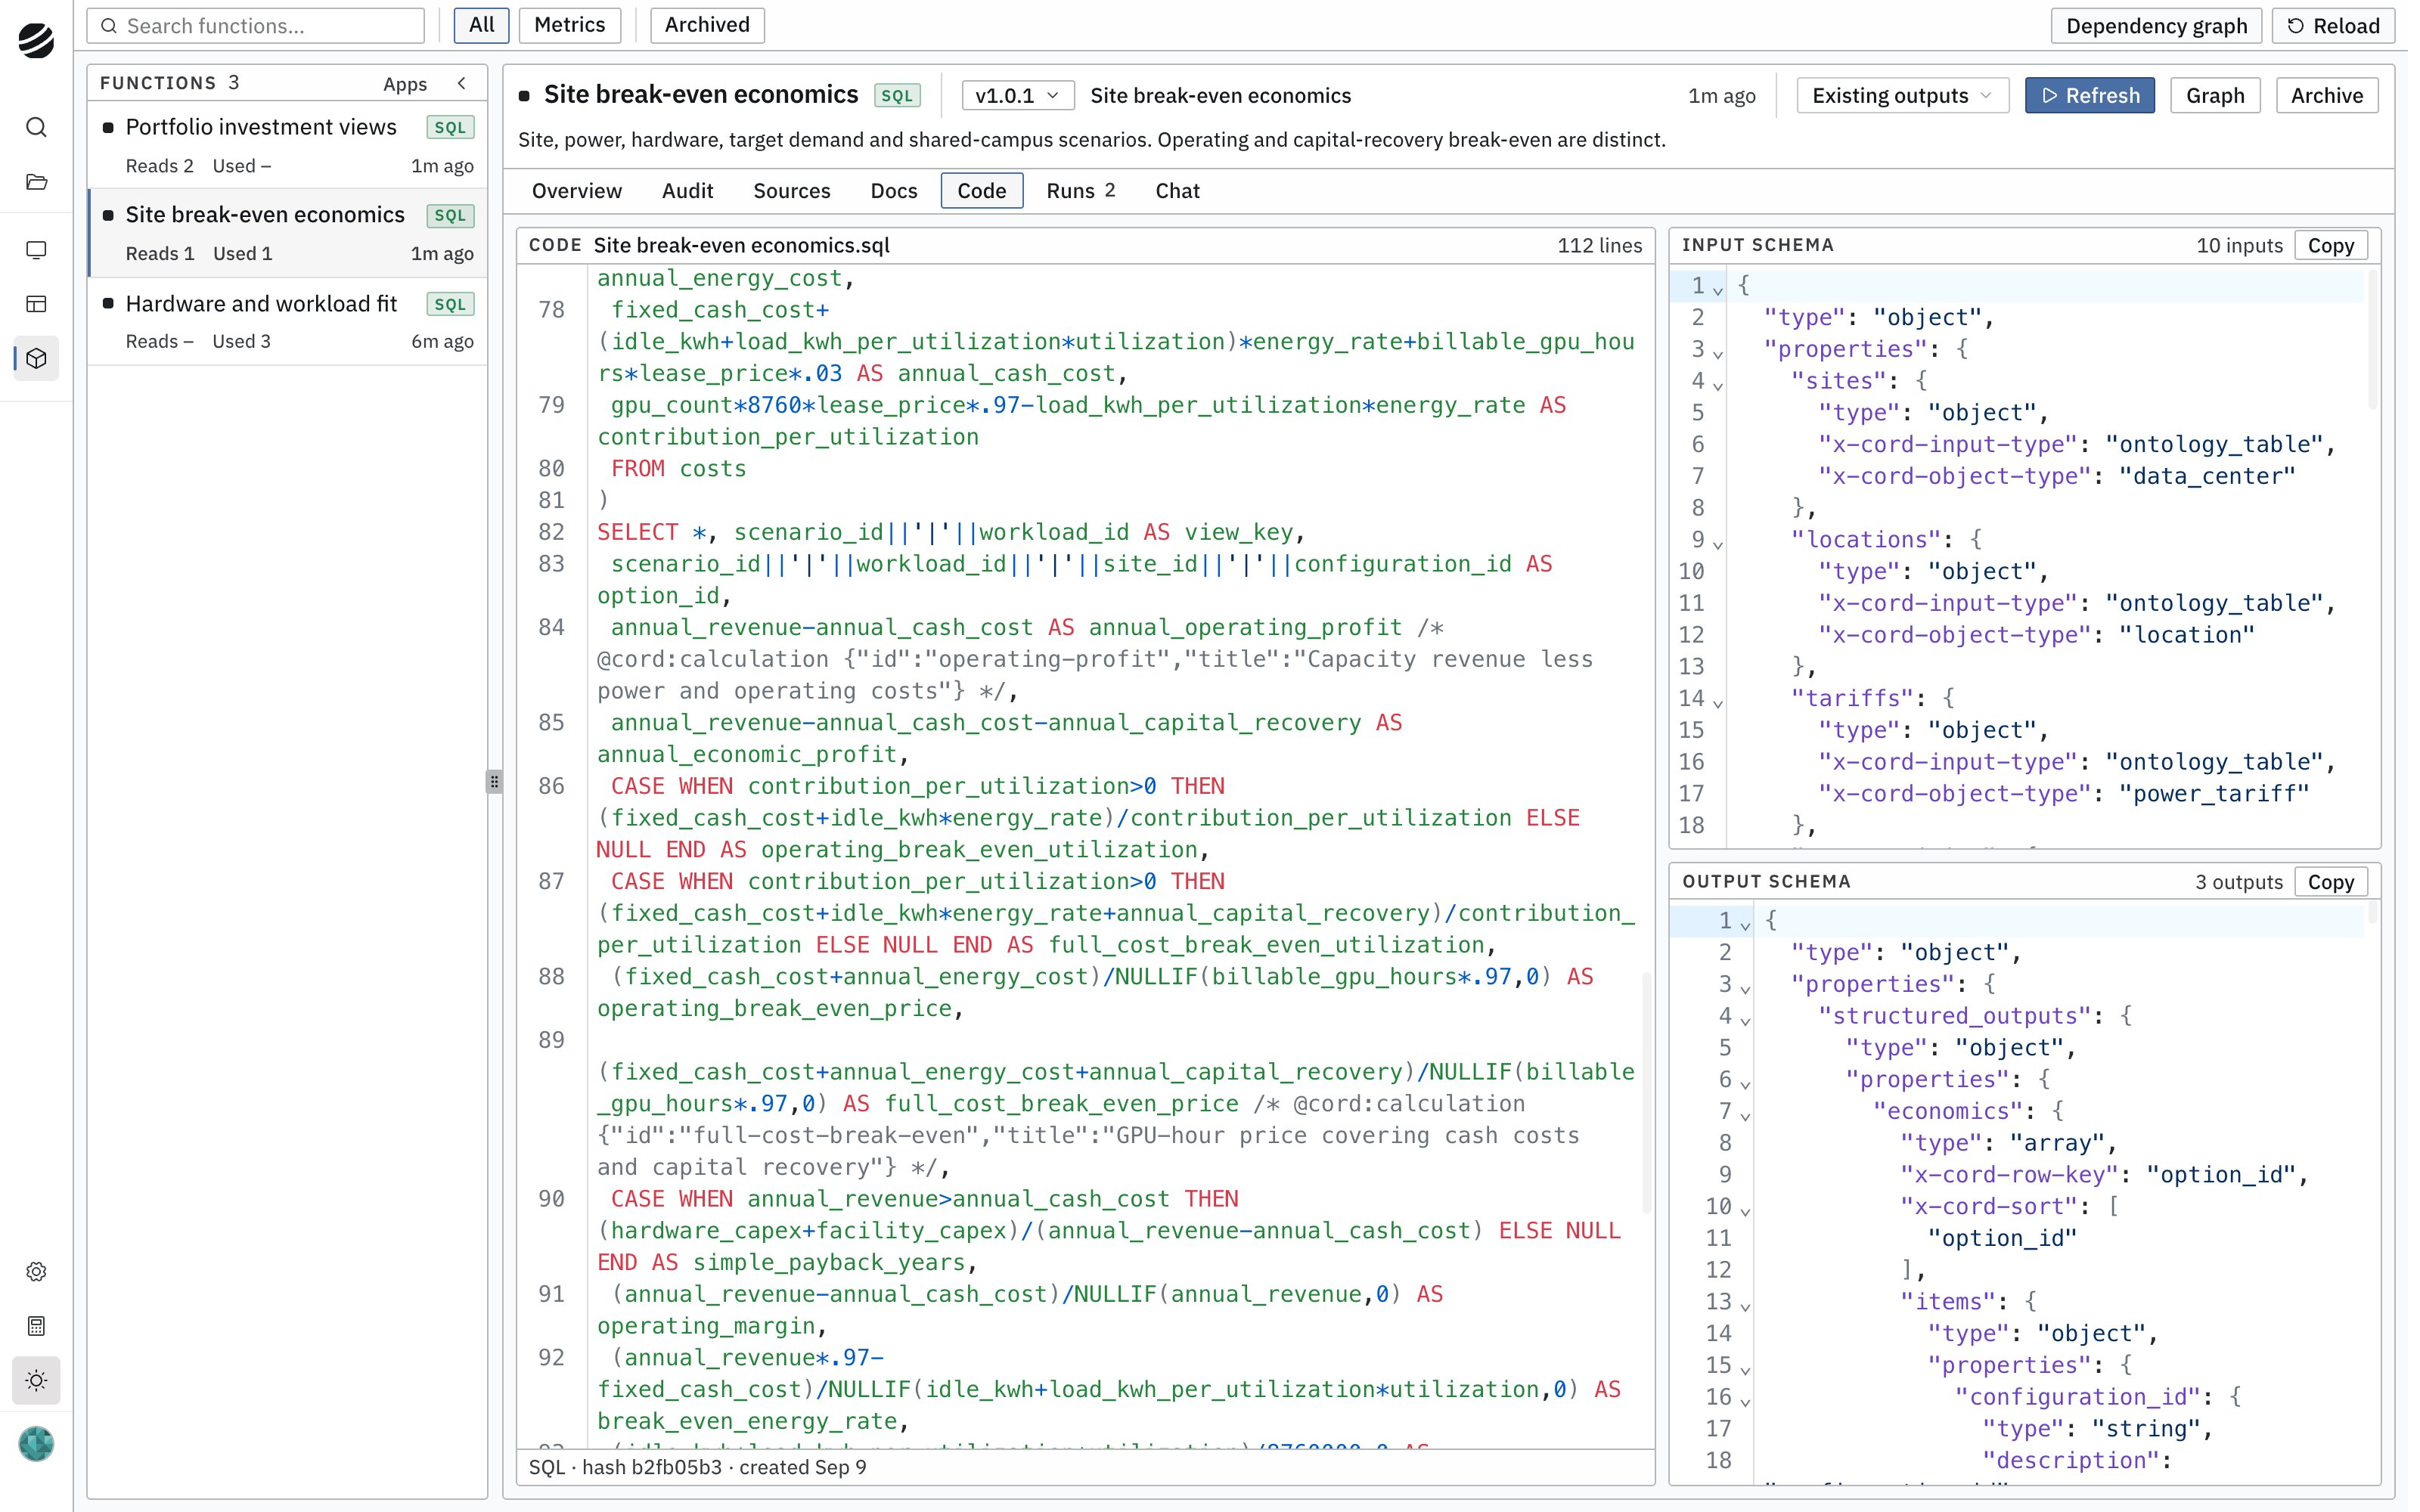
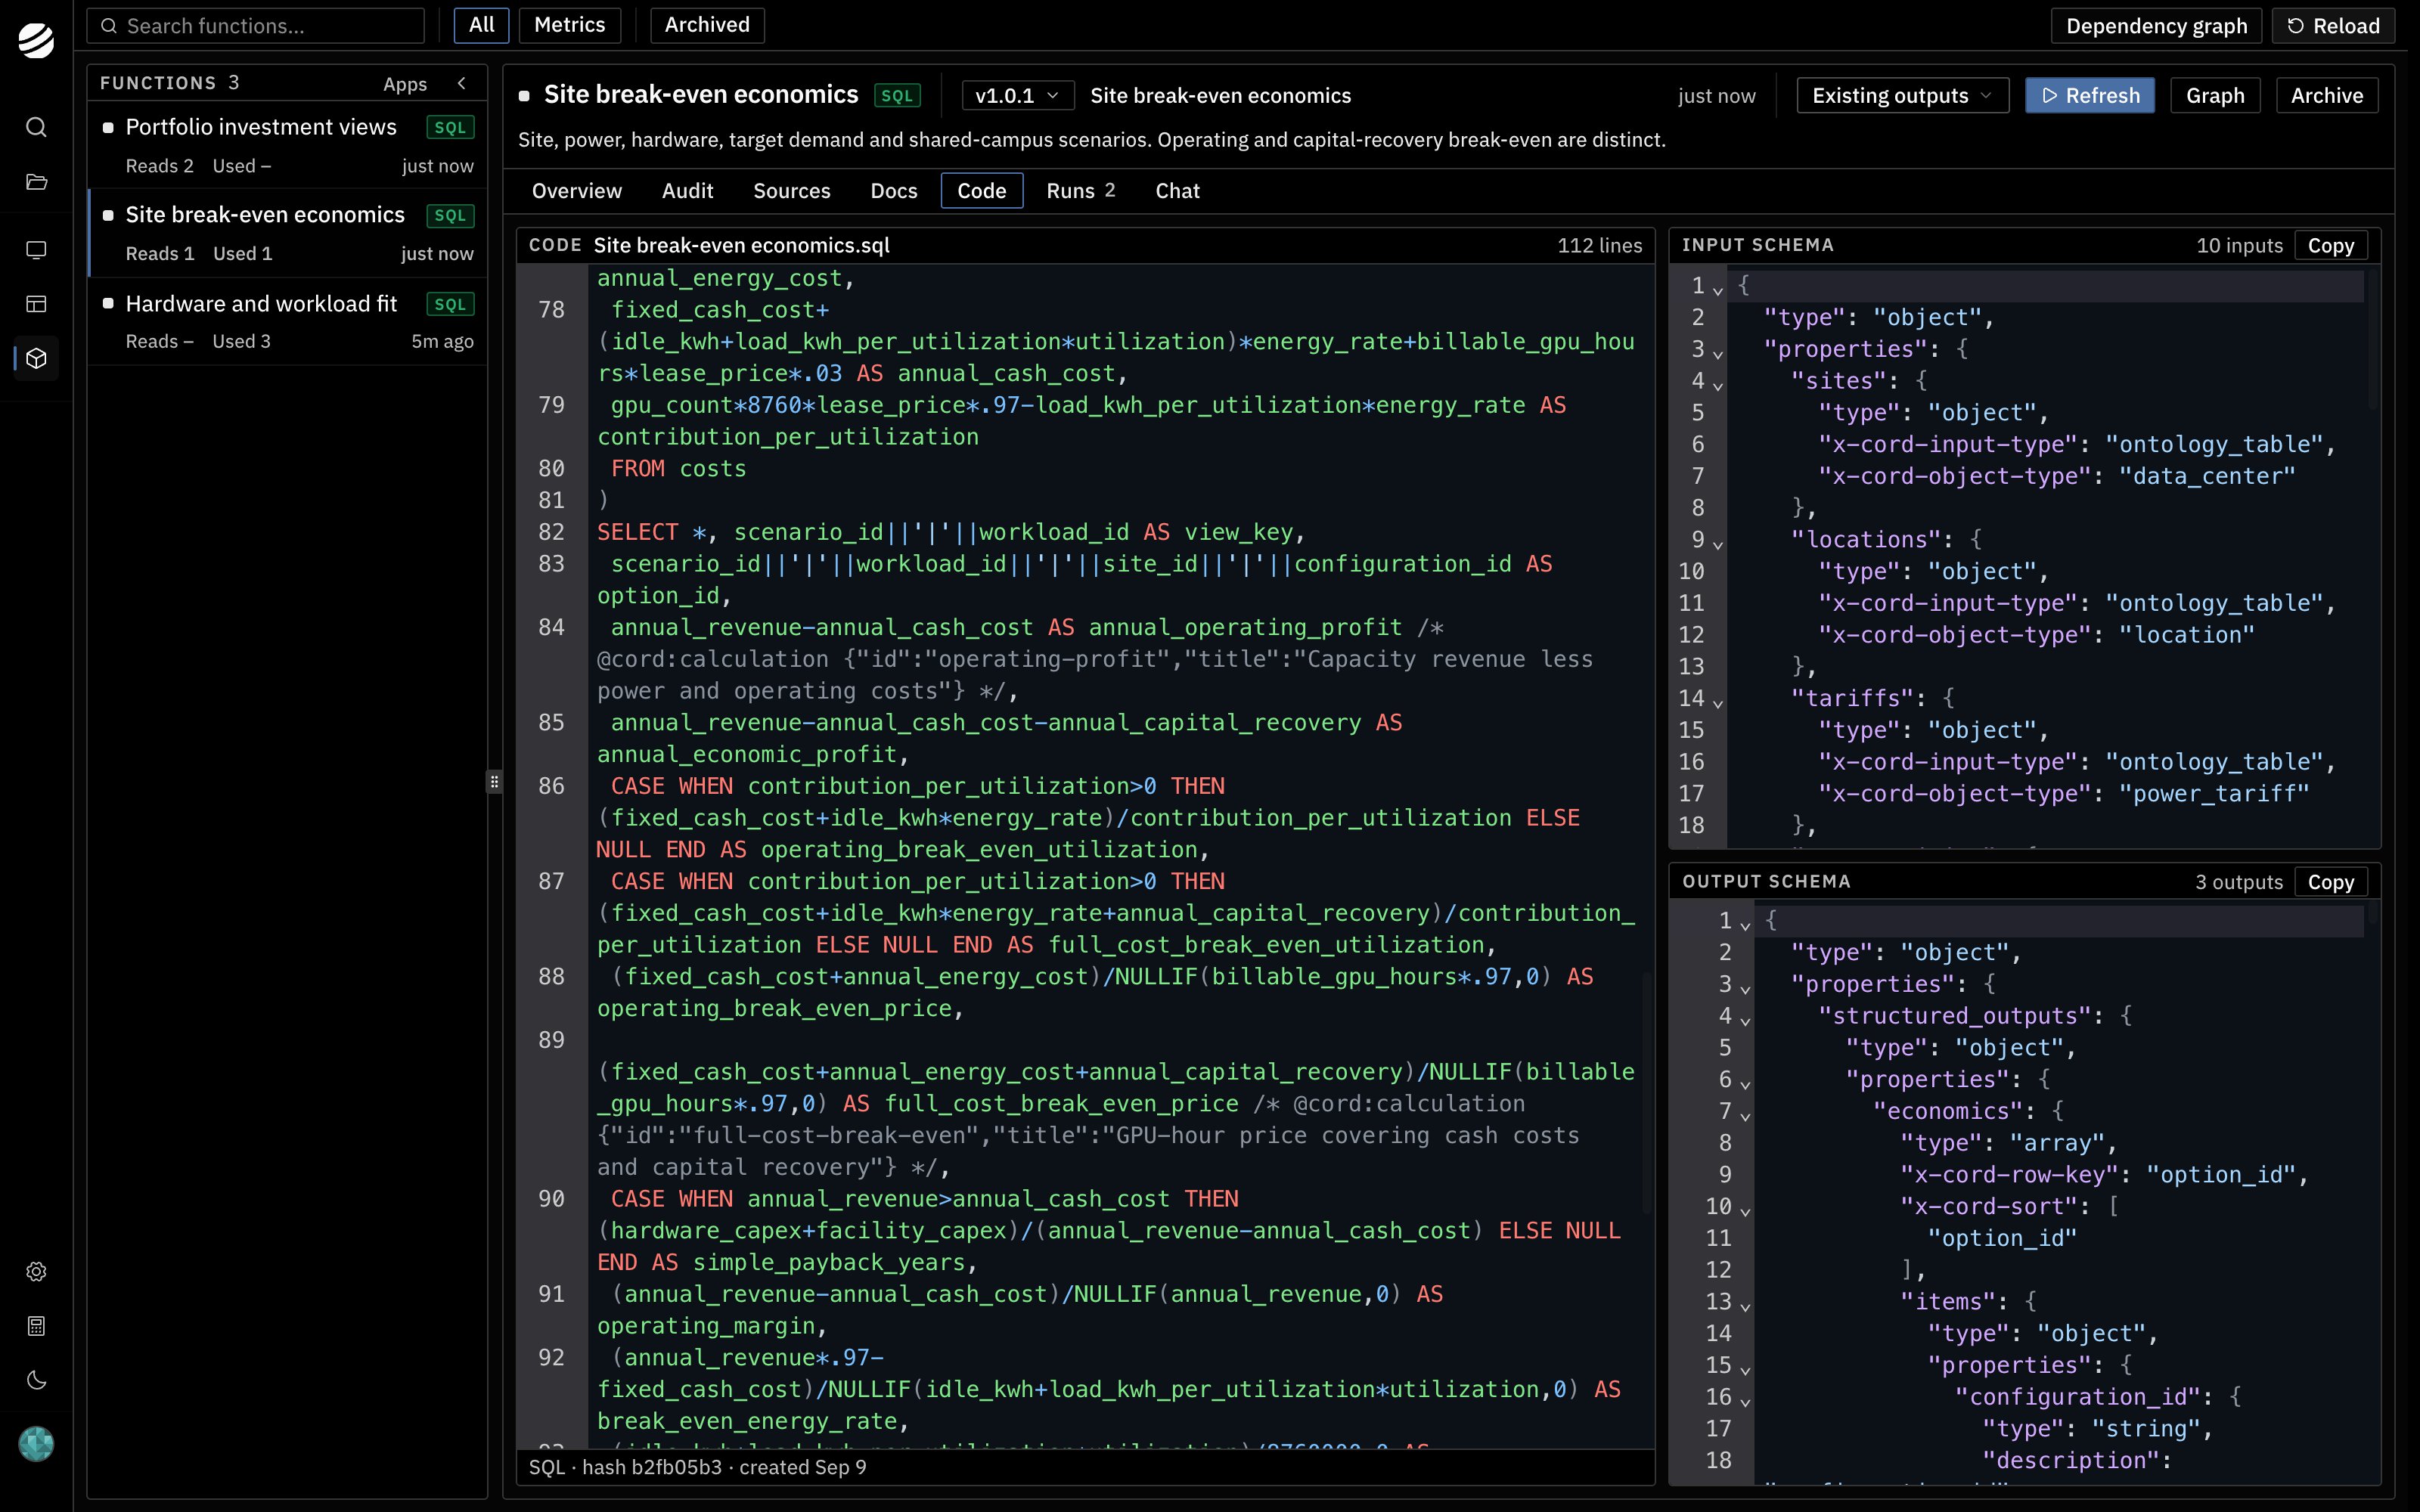
Functions are written and managed by the agent. It works from the business objects involved, writes the logic, runs it, and checks the output. The result comes back with an explanation of what was computed, and the code is visible in the Functions workspace.

<Tabs>
  <Tab title="Compute capex">
    <Frame caption="The Code tab. Operating profit, economic profit, and break-even, written by the agent.">
      <img className="block dark:hidden" src="https://mintcdn.com/cord/Ov8oNa6INQN9kYdr/images/us-compute-functions-code-light.png?fit=max&auto=format&n=Ov8oNa6INQN9kYdr&q=85&s=d5064756176b777afd296b503e6fb0b4" alt="The Code tab of the site break-even economics function showing the logic for operating profit, economic profit, and break-even utilization" width="3200" height="2000" data-path="images/us-compute-functions-code-light.png" />

      <img className="hidden dark:block" src="https://mintcdn.com/cord/Ov8oNa6INQN9kYdr/images/us-compute-functions-code-dark.png?fit=max&auto=format&n=Ov8oNa6INQN9kYdr&q=85&s=ed4e875318ba1be3307b65453454d860" alt="The Code tab of the site break-even economics function showing the logic for operating profit, economic profit, and break-even utilization" width="3200" height="2000" data-path="images/us-compute-functions-code-dark.png" />
    </Frame>
  </Tab>

  <Tab title="Customer economics">
    <Frame caption="The Code tab. Contribution, payback, and horizon contribution, written by the agent.">
      <img className="block dark:hidden" src="https://mintcdn.com/cord/Ov8oNa6INQN9kYdr/images/functions-code-light.png?fit=max&auto=format&n=Ov8oNa6INQN9kYdr&q=85&s=c118757361bb78f4b4d2d5dcf0abc1b9" alt="The Code tab of the customer economics function showing the logic for contribution, payback, and horizon contribution" width="3200" height="2000" data-path="images/functions-code-light.png" />

      <img className="hidden dark:block" src="https://mintcdn.com/cord/Ov8oNa6INQN9kYdr/images/functions-code-dark.png?fit=max&auto=format&n=Ov8oNa6INQN9kYdr&q=85&s=35a28641f237eb9514b6de31aad0d61a" alt="The Code tab of the customer economics function showing the logic for contribution, payback, and horizon contribution" width="3200" height="2000" data-path="images/functions-code-dark.png" />
    </Frame>
  </Tab>
</Tabs>

The agent also maintains them over time: revising the logic when a definition changes, rerunning when inputs change, and retiring functions that nothing uses. Each change creates a new version. Data setups keep using the version they were on until they are moved, and every earlier run is kept, so a number cited last quarter still opens to the version and inputs that produced it.

## Worked examples

The same three parts, definition, data setup, and run, hold for a function of any size. Below are two: one that scores each candidate site for a capital investment, and one that scores each customer. Pick the one closer to your business.

<Tabs>
  <Tab title="Compute capex">
    A site break-even function scores each candidate data center under each planning scenario. From Data Center it reads the site's GPU count and capex. From Power Tariff it reads the energy rate at the site's location. From Planning Scenario it reads billable utilization, lease price, and the capital recovery rate $r$. Server cost and power draw come from an upstream function, Hardware and workload fit. It takes two assumptions, an energy factor and a lease factor, both defaulting to 1. It works through six steps, and one of them is conditional.

    $$
    \begin{aligned}
    \text{billable hours} \;&=\; \text{GPUs} \times 8{,}760 \times \text{utilization} \\[14pt]
    \text{net revenue} \;&=\; \text{billable hours} \times \text{lease price} \times (1 - \text{fee}) \\[14pt]
    \text{operating profit} \;&=\; \text{net revenue} - \text{energy cost} - \text{site cash cost} \\[14pt]
    \text{economic profit} \;&=\; \text{operating profit} - \text{capital recovery} \\[14pt]
    \text{break-even price} \;&=\; \frac{\text{energy cost} + \text{site cash cost} + \text{capital recovery}}{\text{billable hours} \times (1 - \text{fee})} \\[14pt]
    \text{status} \;&=\;
    \begin{cases}
    \text{capital-accretive} & \text{if economic profit} > 0 \\
    \text{not accretive} & \text{otherwise}
    \end{cases}
    \end{aligned}
    $$

    Capital recovery is the annual charge for the hardware over 5 years and the facility over 15, plus the scenario's return $r$ on the capital. The fee is 3% of revenue.

    For one site and design, Dallas 01 with 30,648 H200 GPUs, under two scenarios:

    |                  | Base case                                     | Demand downside                               |
    | ---------------- | --------------------------------------------- | --------------------------------------------- |
    | Billable hours   | 30,648 × 8,760 × 69% = 185.2M                 | 30,648 × 8,760 × 53.8% = 144.4M               |
    | Net revenue      | 185.2M × \$3.38 = \$626.3M, × 0.97 = \$607.5M | 144.4M × \$2.87 = \$415.2M, × 0.97 = \$402.7M |
    | Operating profit | \$607.5M − \$11.7M − \$53.6M = \$542.2M       | \$402.7M − \$10.9M − \$51.8M = \$340.0M       |
    | Capital recovery | \$394.9M at $r$ = 10%                         | \$399.3M at $r$ = 12%                         |
    | Economic profit  | \$542.2M − \$394.9M = \$147.3M                | \$340.0M − \$399.3M = −\$59.3M                |
    | Break-even price | \$460.2M ÷ 179.6M hours = \$2.56 per GPU-hour | \$462.0M ÷ 140.1M hours = \$3.30 per GPU-hour |
    | Status           | capital-accretive                             | not accretive                                 |

    Three object types, one upstream function, and two assumptions take part. The scenario is an object, so one run scores every site under every scenario, and the app's scenario buttons switch between rows of the same output. A second function, Portfolio investment views, rolls the sites up into plan totals. The app shows the site comparison from the first and the KPI tiles from the second.

    <FunctionExampleCompute />
  </Tab>

  <Tab title="Customer economics">
    A customer economics function reads each customer's revenue, margin, support cost, and acquisition cost. It also reads two other object types. Segment supplies the target payback and an account management cost pool. Product supplies a platform cost pool. Each pool is allocated: the segment pool equally across the customers in the segment, the product pool by share of revenue on the product. It takes one assumption, a planning horizon $h$. It works through five steps, and two of them are conditional.

    $$
    \begin{aligned}
    \text{indirect cost} \;&=\; \frac{\text{segment account cost}}{\text{customers in segment}} + \text{product platform cost} \times \frac{\text{revenue}}{\text{product revenue}} \\[14pt]
    \text{contribution} \;&=\; \text{revenue} \times \text{margin} - \text{support cost} - \text{indirect cost} \\[14pt]
    \text{payback} \;&=\;
    \begin{cases}
    \dfrac{\text{acquisition cost}}{\text{contribution}} & \text{if contribution} > 0 \\[8pt]
    \text{undefined} & \text{otherwise}
    \end{cases} \\[14pt]
    \text{status} \;&=\;
    \begin{cases}
    \text{negative contribution} & \text{if contribution} \le 0 \\
    \text{above target} & \text{if payback} > \text{segment target} \\
    \text{within target} & \text{otherwise}
    \end{cases} \\[14pt]
    \text{horizon contribution} \;&=\; \text{contribution} \times h
    \end{aligned}
    $$

    For two customers, with $h = 36$ months:

    |                      | C-100, Studio Collective                                  | C-10005, Service Groups                      |
    | -------------------- | --------------------------------------------------------- | -------------------------------------------- |
    | Segment allocation   | \$12,000 ÷ 400 customers = \$30                           | \$45,000 ÷ 150 customers = \$300             |
    | Product allocation   | \$60,000 × \$1,000 ÷ \$1,200,000 = \$50                   | \$90,000 × \$5,350 ÷ \$900,000 = \$535       |
    | Indirect cost        | \$30 + \$50 = \$80                                        | \$300 + \$535 = \$835                        |
    | Contribution         | \$1,000 × 0.70 − \$200 − \$80 = \$420                     | \$5,350 × 0.853 − \$5,117 − \$835 = −\$1,388 |
    | Payback              | \$2,500 ÷ \$420 = 6 months                                | undefined                                    |
    | Status               | 6 months against a 12-month segment target: within target | negative contribution                        |
    | Horizon contribution | \$420 × 36 = \$15,120                                     | −\$1,388 × 36 = −\$49,968                    |

    Three object types take part. Customer supplies the facts, Segment the target and the account management pool, and Product the platform pool. The customer count per segment and the revenue per product are aggregates the function computes before it allocates. Each step reads the one before it, and $h$ is an assumption that can be changed without touching the logic. A second function reads this one's output and rolls it up into portfolio totals and segment summaries. The app shows the customer table from the first and the KPI tiles from the second.

    <FunctionExample />
  </Tab>
</Tabs>

## Assumptions and scenarios

A rule is a condition in the logic: a case per segment, a filter, a flag column. The threshold behind it is an assumption on the data setup, a single value such as a planning horizon, a capital recovery rate, or a payback limit, so it can be changed without touching the code. Changing an assumption marks the function stale. Rerunning it recomputes the result, and the functions that depend on it can be rerun in order after it.

A scenario is a second data setup with different assumptions. Both runs are kept, so the base case and the scenario can be compared side by side.

## One definition, many apps

Functions build on each other. A site economics function can feed a portfolio view, a plan builder, and a deal model, and each of those can feed further functions. Because the definition lives in one place, the investment committee, the site team, and corporate development are looking at the same number, and a change to the definition reaches all of them through the same versioning.

## Agents use functions too

A function is deterministic code. The same inputs produce the same output every time, and the logic can be read and audited. When an agent in Cord needs a number, it runs the function and cites the result rather than working the calculation out itself. That is what lets an agent answer a question about payback or return on capital with a number that is reproducible and traceable, the same way an app would show it.

## Tracing a number

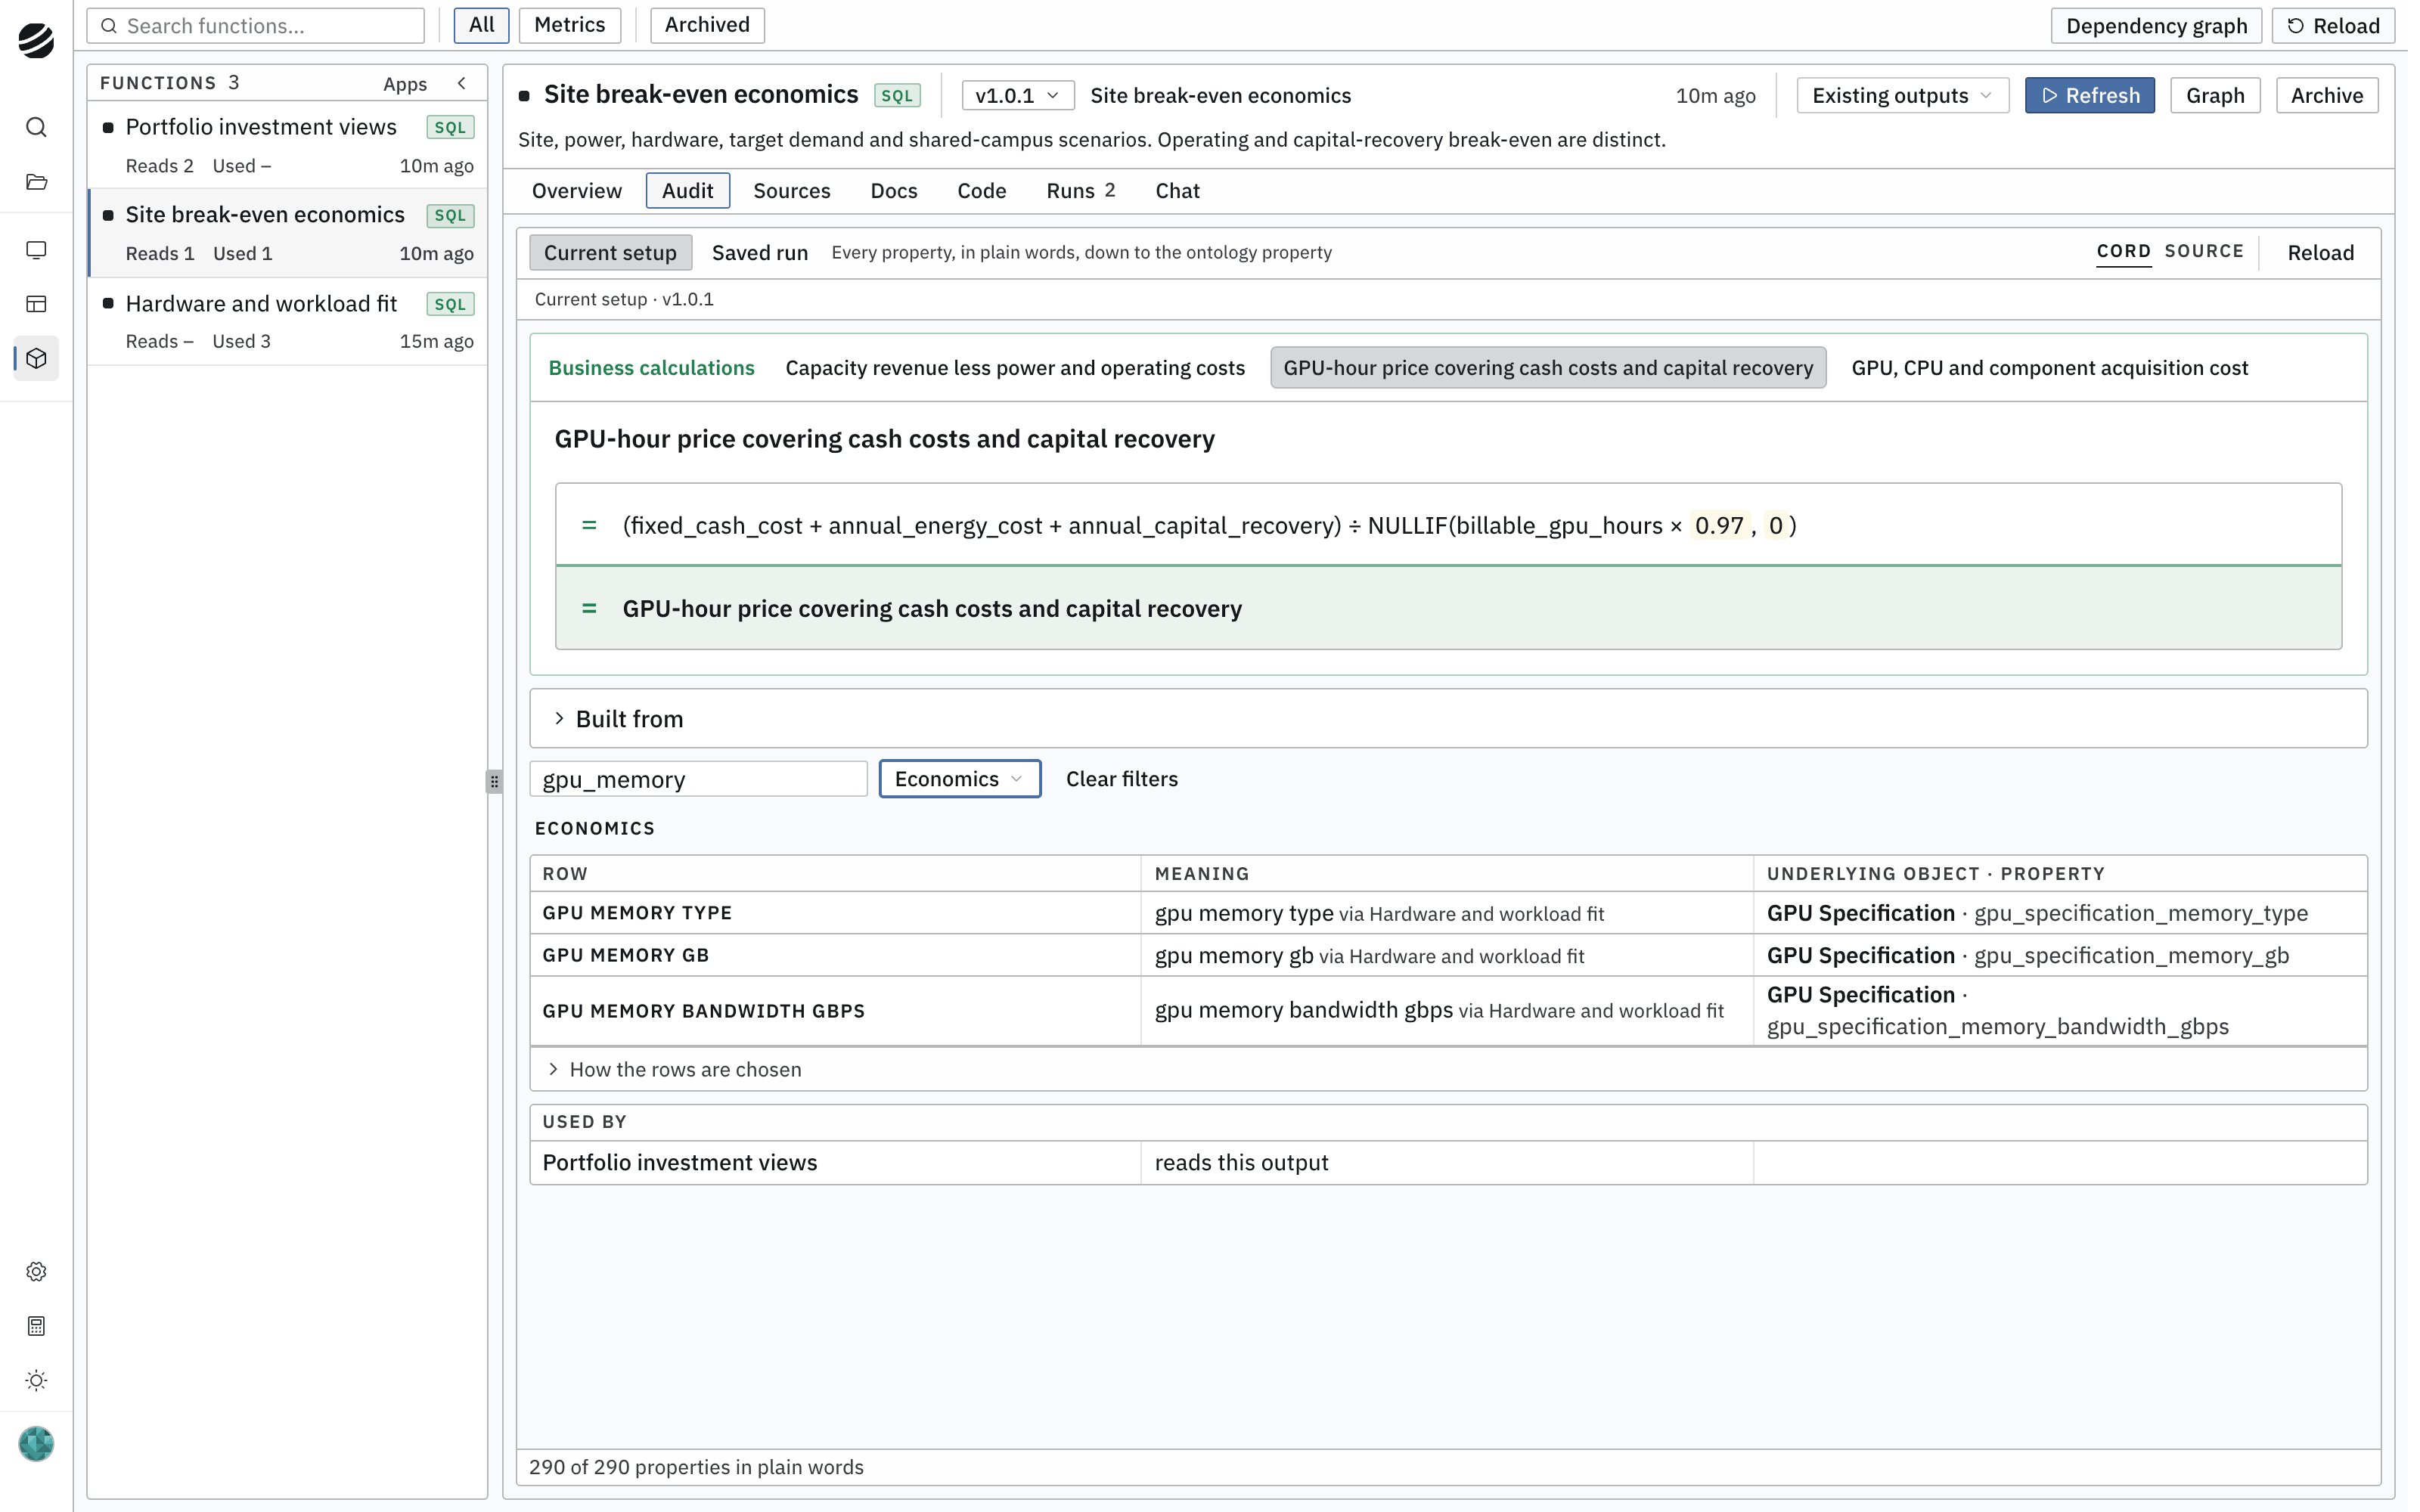
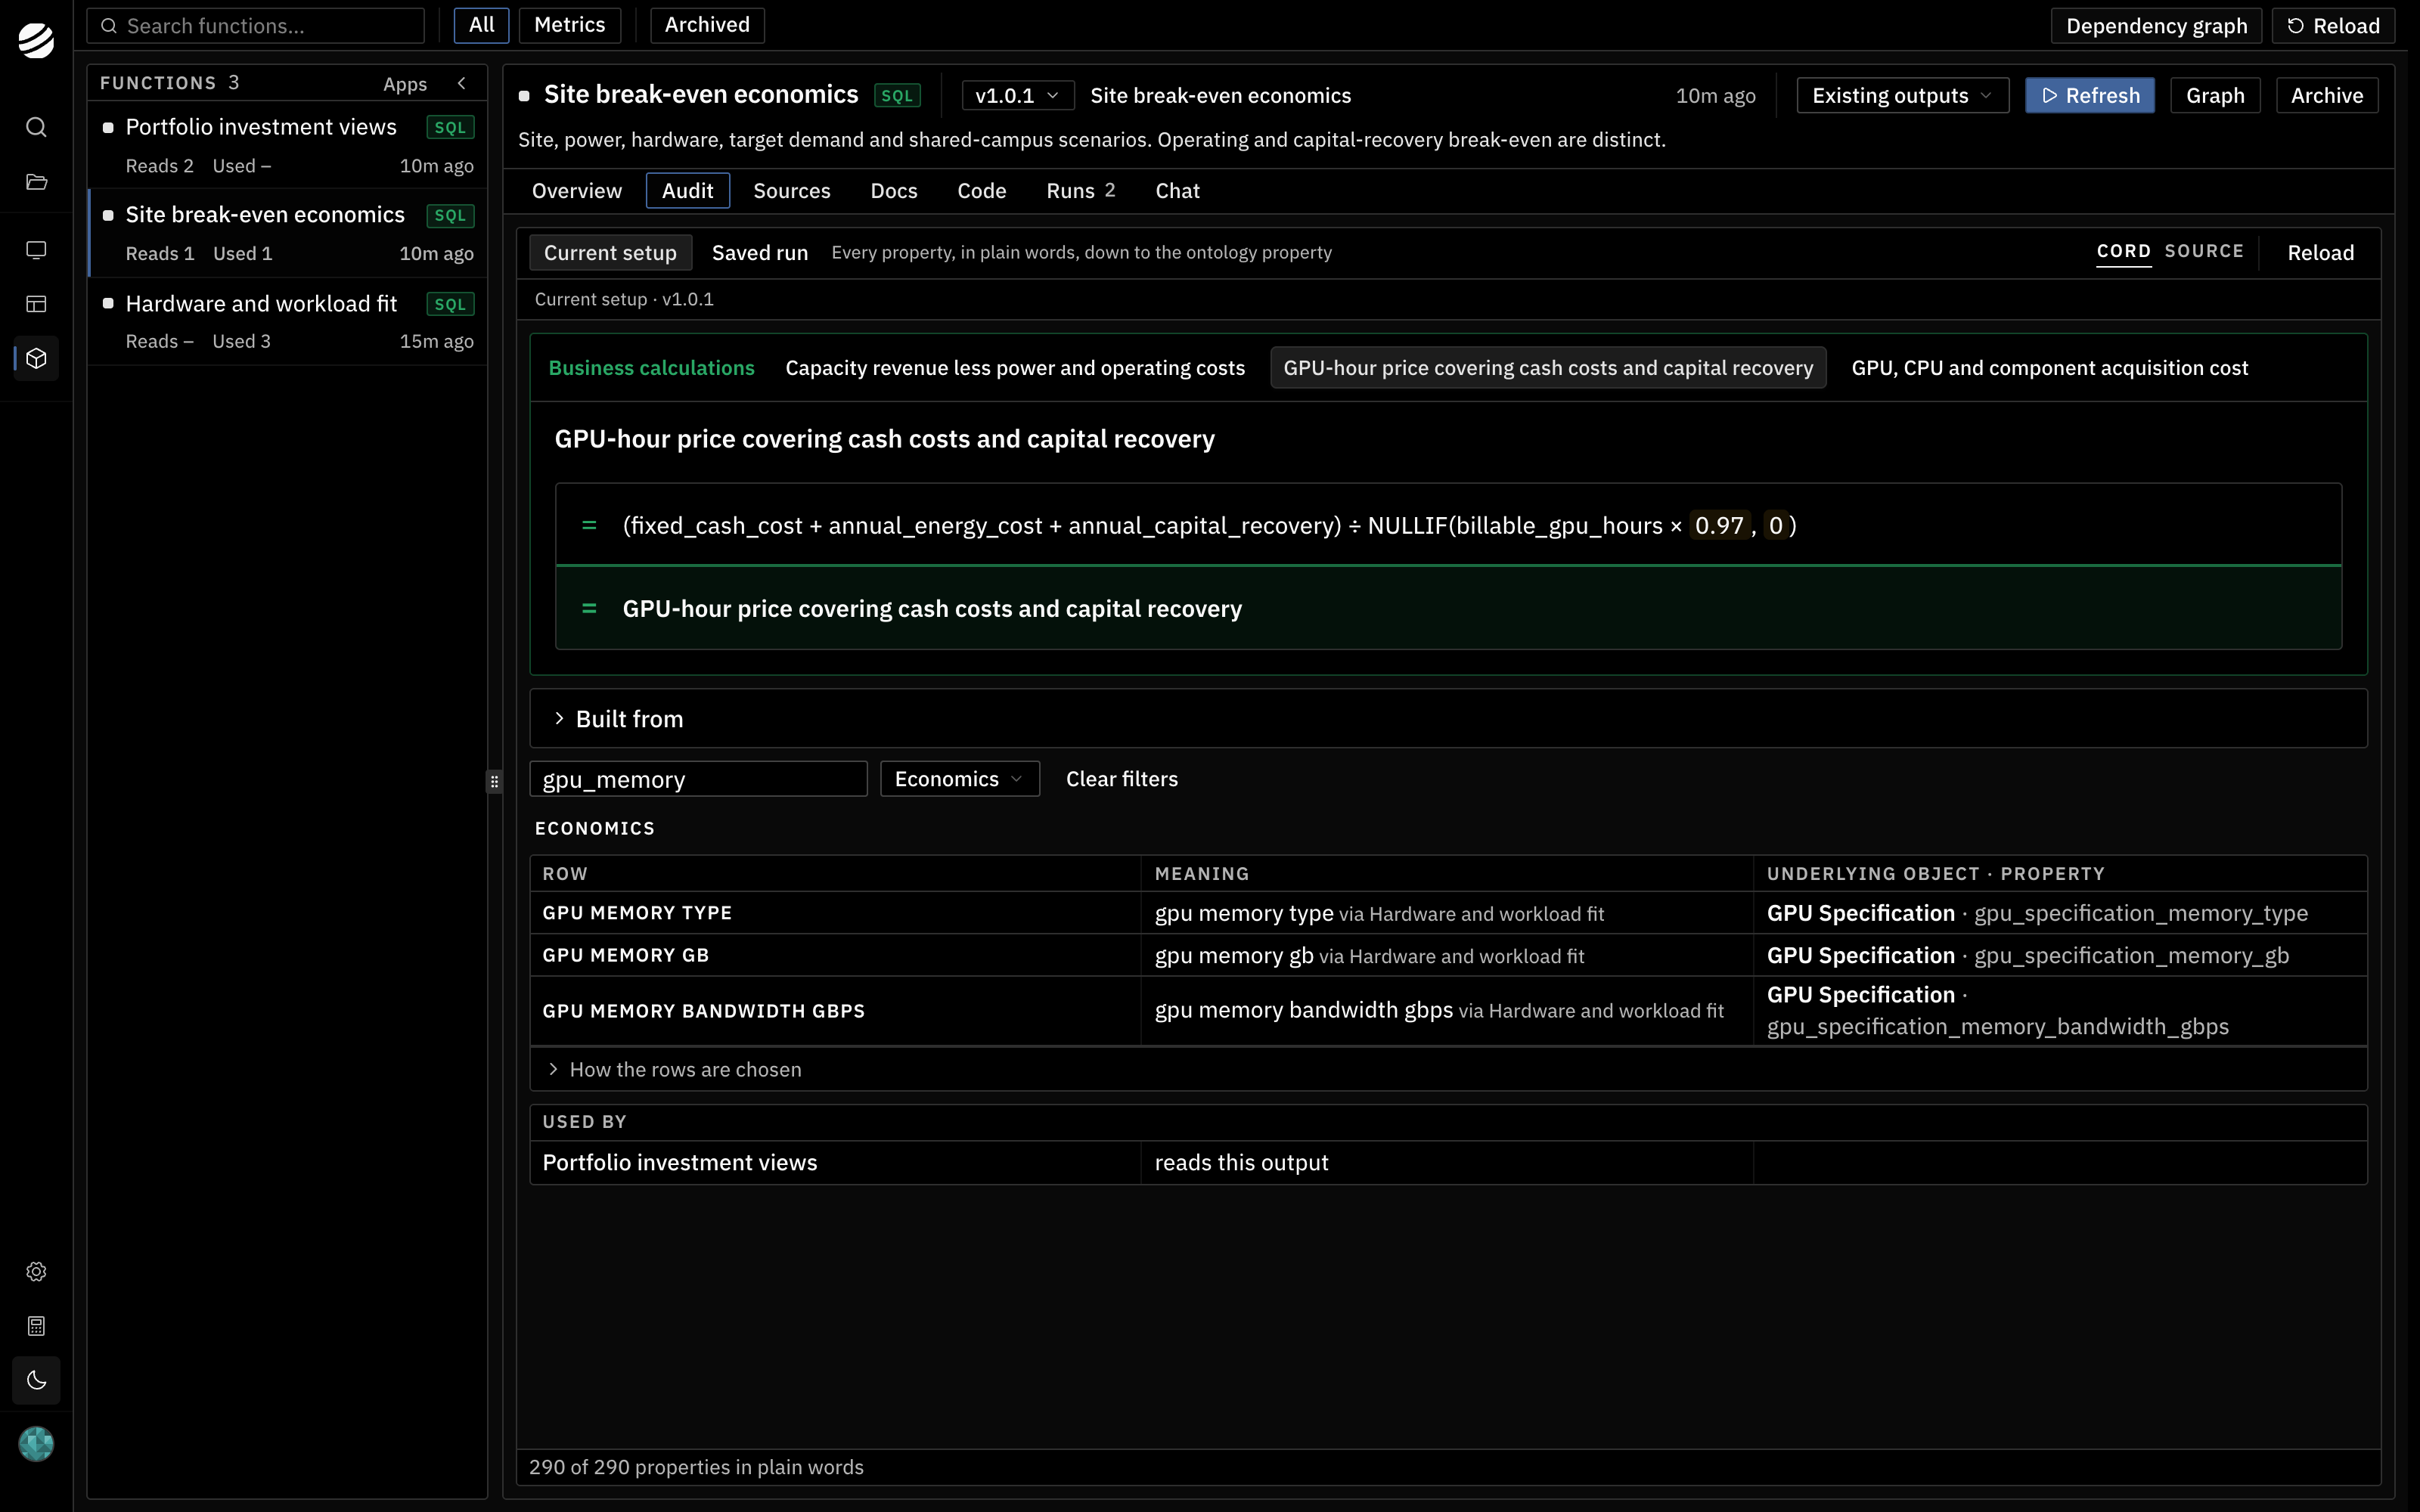
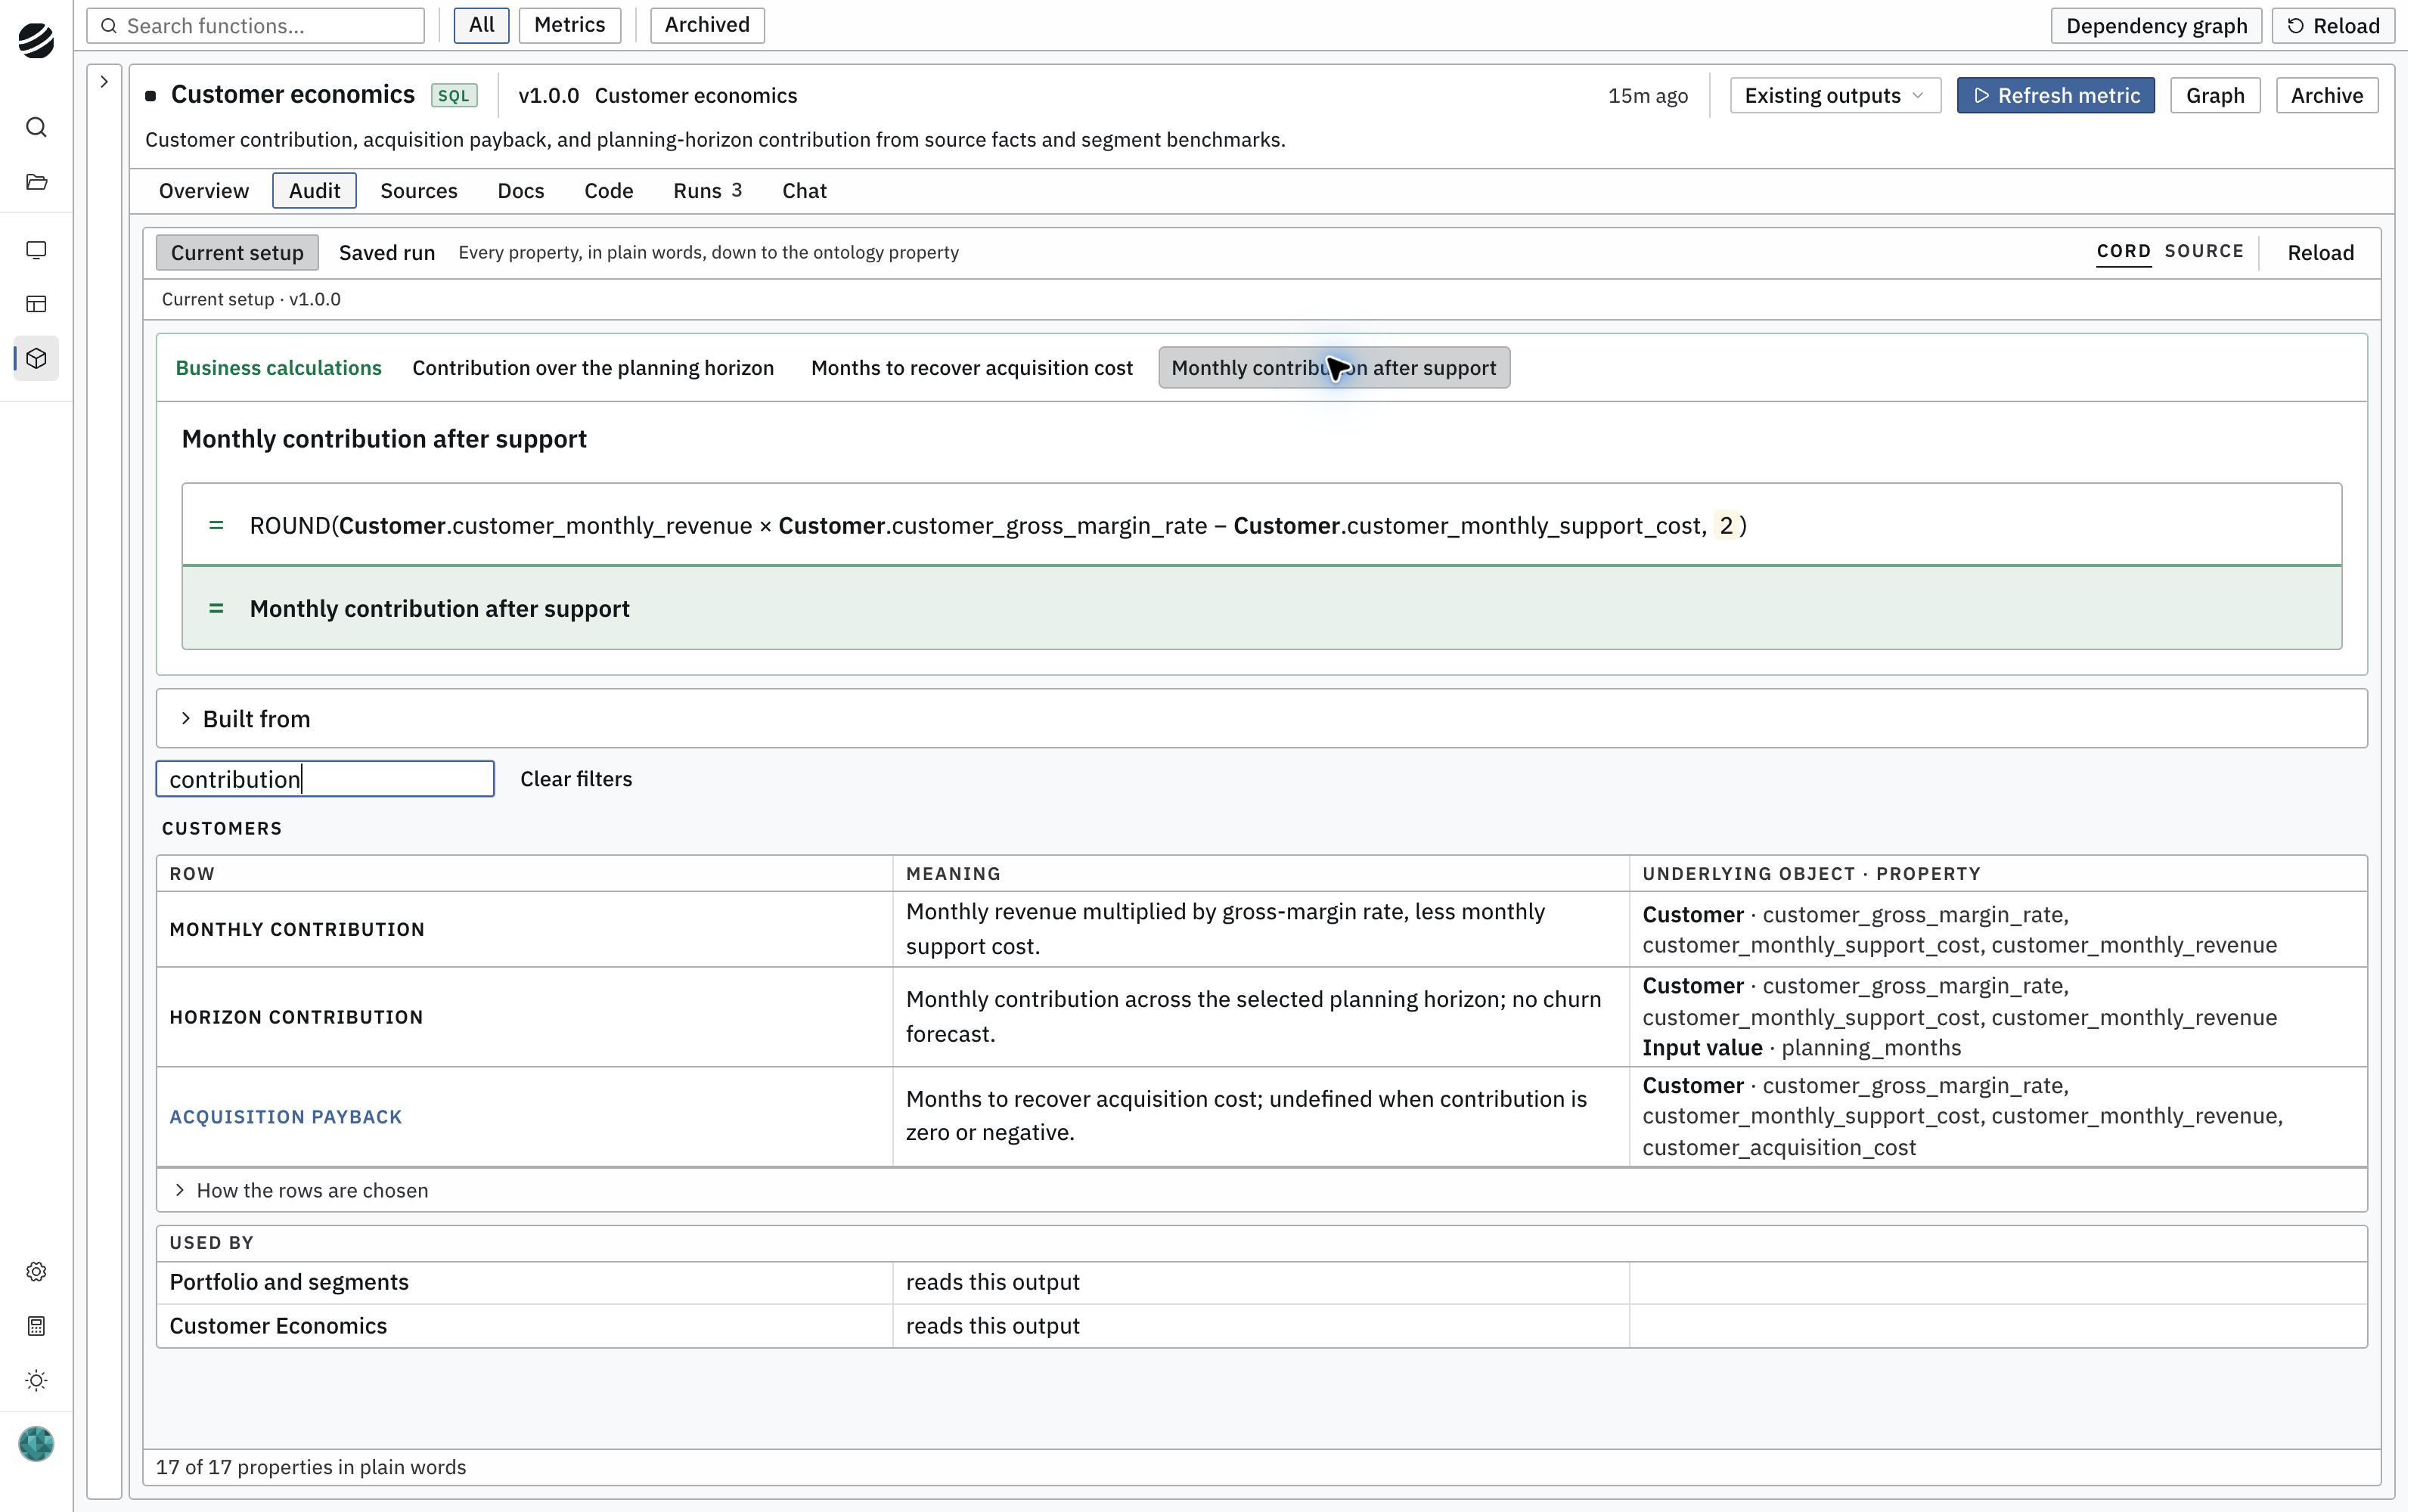
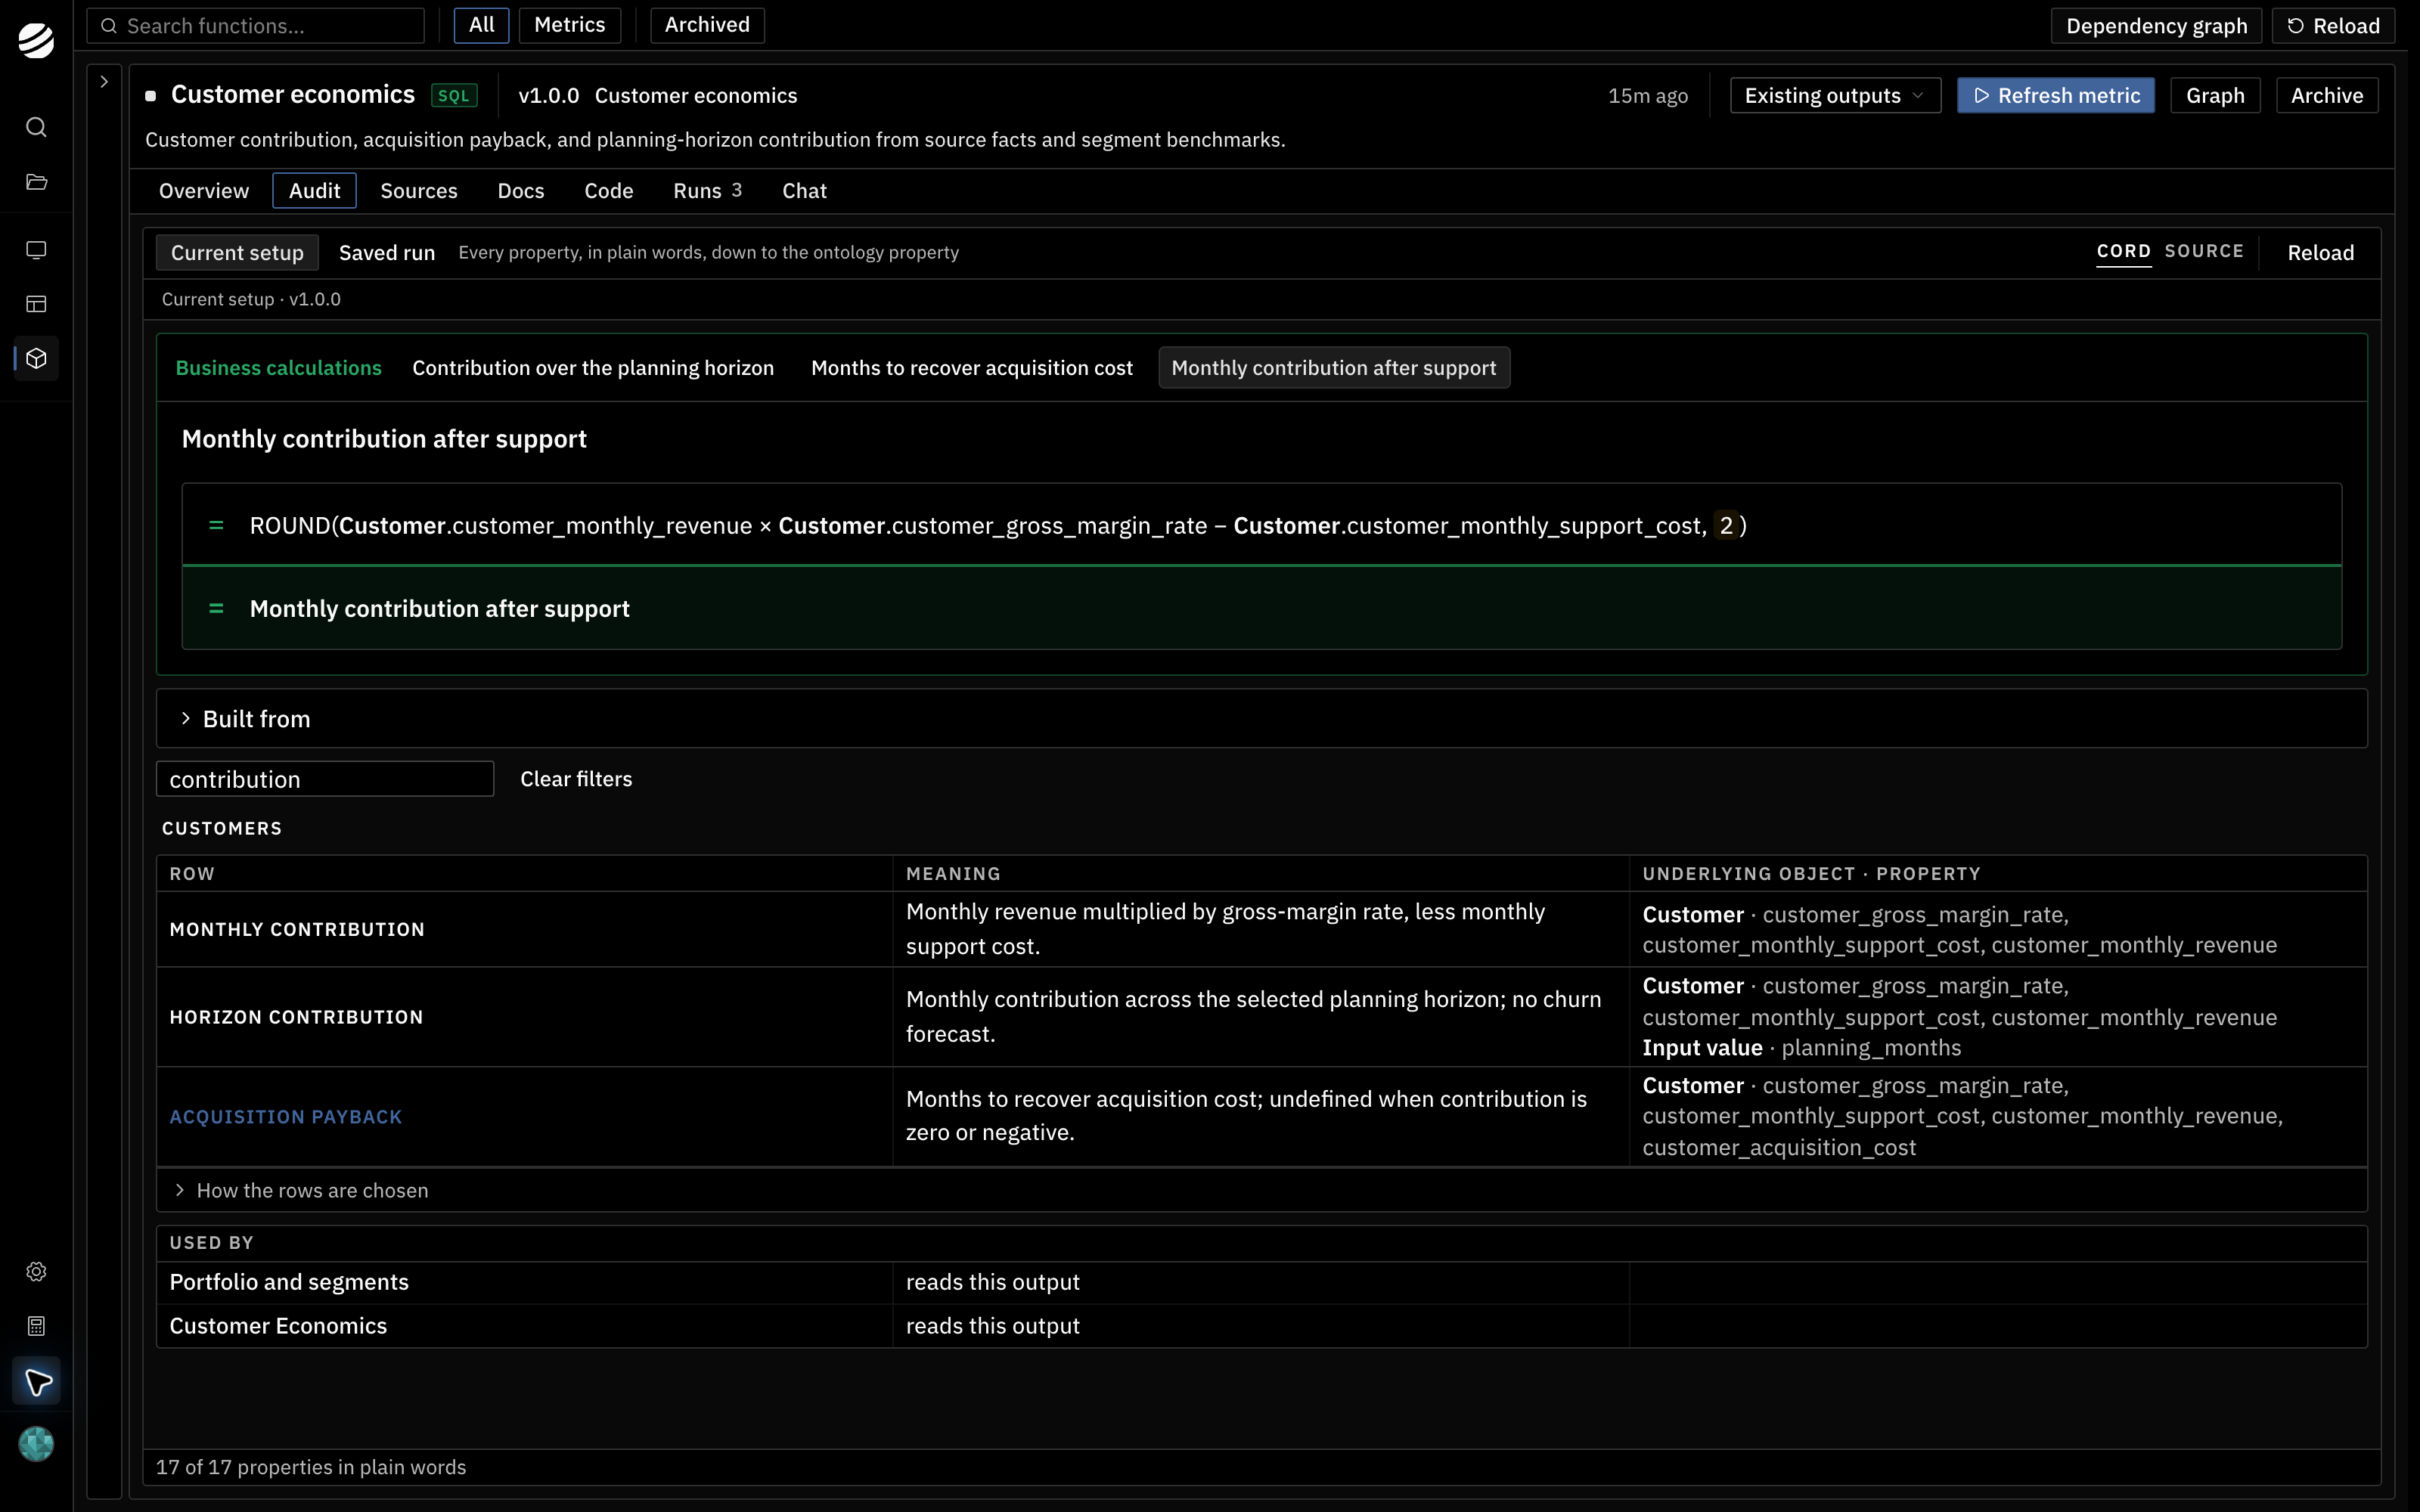
Every output of a function can be followed back to what produced it. The Audit tab describes each output in plain words, shows the formula with the business objects and fields it reads, and for aggregates shows the rows that contributed.

<Tabs>
  <Tab title="Compute capex">
    <Frame caption="The Audit tab: a break-even price in plain words, traced through a second function to the GPU specification.">
      <img className="block dark:hidden" src="https://mintcdn.com/cord/Ov8oNa6INQN9kYdr/images/us-compute-functions-audit-light.png?fit=max&auto=format&n=Ov8oNa6INQN9kYdr&q=85&s=e61ff0622644651aeff7815755c449fc" alt="The Audit tab showing the full-cost break-even price in plain words and the GPU Specification properties it is built from" width="3200" height="2000" data-path="images/us-compute-functions-audit-light.png" />

      <img className="hidden dark:block" src="https://mintcdn.com/cord/Ov8oNa6INQN9kYdr/images/us-compute-functions-audit-dark.png?fit=max&auto=format&n=Ov8oNa6INQN9kYdr&q=85&s=66ac5bea2292400253ed153f1b253515" alt="The Audit tab showing the full-cost break-even price in plain words and the GPU Specification properties it is built from" width="3200" height="2000" data-path="images/us-compute-functions-audit-dark.png" />
    </Frame>
  </Tab>

  <Tab title="Customer economics">
    <Frame caption="The Audit tab: each output in plain words, with the object fields underneath it.">
      <img className="block dark:hidden" src="https://mintcdn.com/cord/Ov8oNa6INQN9kYdr/images/functions-audit-light.png?fit=max&auto=format&n=Ov8oNa6INQN9kYdr&q=85&s=e27b5dff2807c3f0691260316ae6f4d4" alt="The Audit tab showing monthly contribution in plain words and the Customer properties it is built from" width="3200" height="2000" data-path="images/functions-audit-light.png" />

      <img className="hidden dark:block" src="https://mintcdn.com/cord/Ov8oNa6INQN9kYdr/images/functions-audit-dark.png?fit=max&auto=format&n=Ov8oNa6INQN9kYdr&q=85&s=74049b01935d61e8330ad8387a07b41e" alt="The Audit tab showing monthly contribution in plain words and the Customer properties it is built from" width="3200" height="2000" data-path="images/functions-audit-dark.png" />
    </Frame>
  </Tab>
</Tabs>

The business objects and fields a function reads come from the [ontology](/understanding-cord/ontology), read more next.
<UnderstandingFlow active="functions" />