> ## Documentation Index
> Fetch the complete documentation index at: https://docs.cord.nyc/llms.txt
> Use this file to discover all available pages before exploring further.
> ## Agent Instructions
> You are helping someone use Cord, the capital and resource allocation platform.
> Use title-case Cord in prose. Prefer workspace, project, ontology, lineage, scenario, and allocation.
> Say source-backed or sourced for answers with lineage. Do not say hallucination-free.
> Product URLs are https://app.cord.nyc, https://cord.nyc, and https://trust.cord.nyc. Support is support@cord.nyc.
> Give concrete product steps. Do not invent UI labels, CLI commands, or unreleased agent runtime details.
> Use Understanding Cord for concepts and Guides for task steps.
# Prepare data with a pipeline
> Clean, combine, and reshape your source data into a reusable output.
Don't want to do this all manually?
Cord Computer can do this for you.
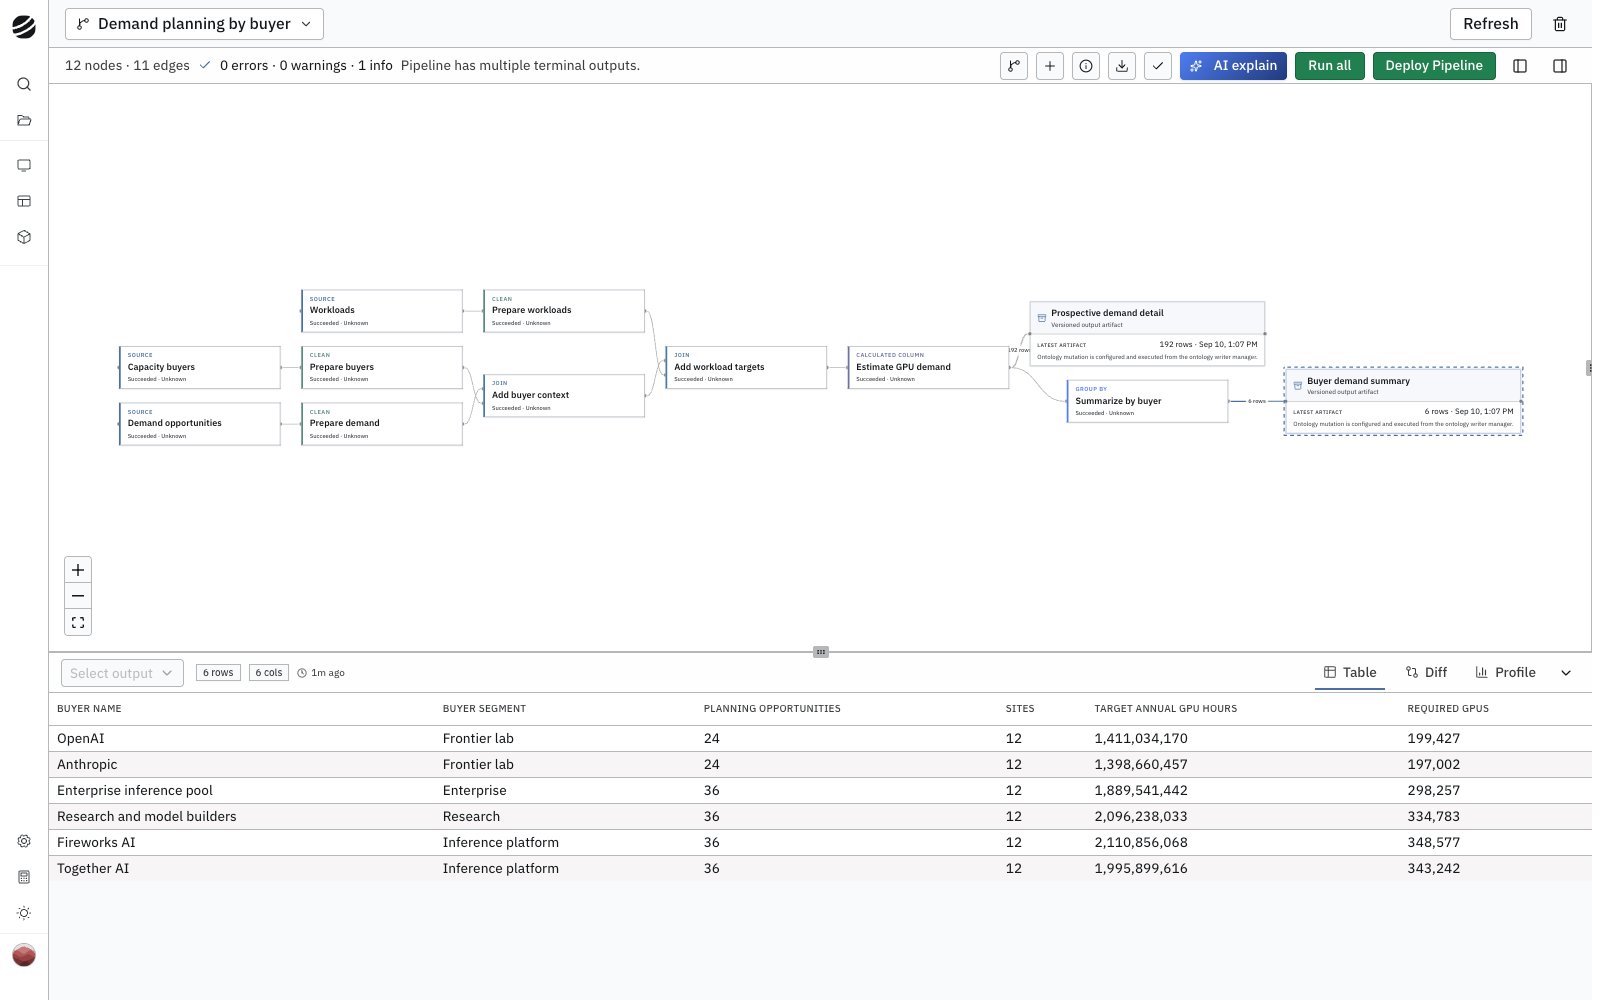
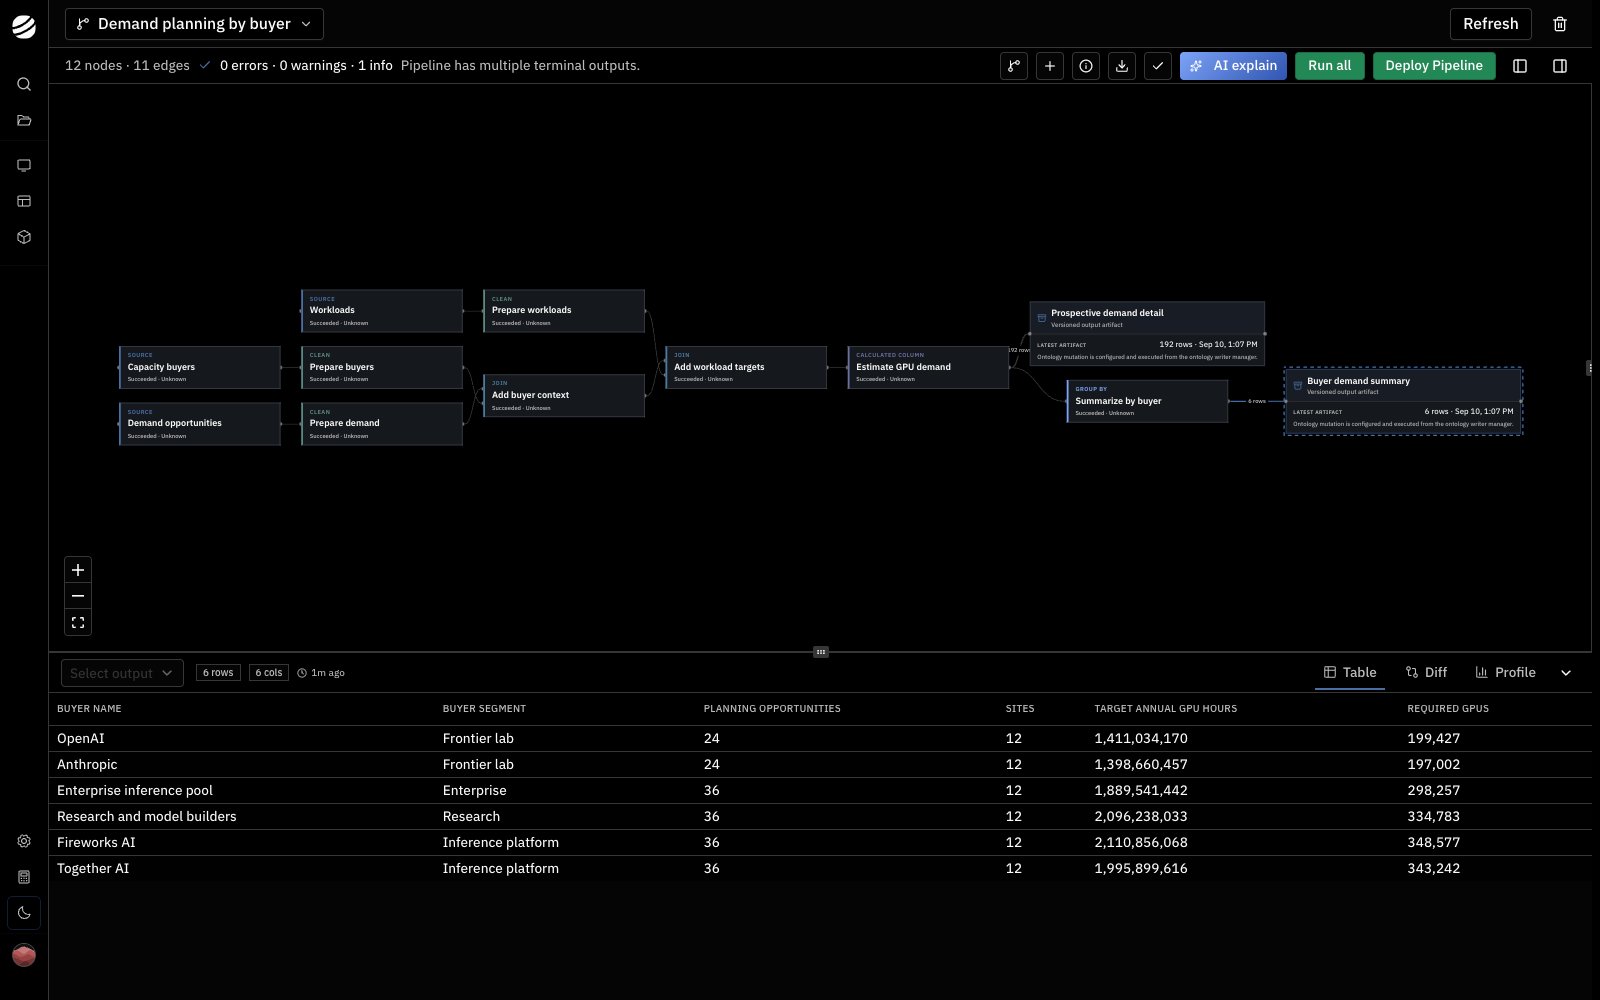
A pipeline connects sources to a series of steps, called nodes. You can preview the data after each step and create separate outputs from different branches.
1. Open [**Pipelines**](https://app.cord.nyc/pipeline-studio) with your project selected.
2. Select **New pipeline**, enter a name, and select **Create pipeline**.
3. Choose a data feed or project file as your source.
4. Use the **+** on a node to add a step, such as **Clean**, **Filter**, or **Group By**. Select the node to configure it.
5. To combine sources, use **Add source**, then add a **Join** step and choose the inputs and matching columns.
6. Select a step and choose **Run to here** to check its rows in the preview.
7. Add a **Pipeline Output** node at the end of a branch. Select it and choose **Create artifact** to save an output version.
Your output is ready to preview, export, or [write to your ontology](/write-pipeline-data-to-ontology).
 ## Node types
| Node | Use it to |
| ----------------- | --------------------------------------------------------------------------------- |
| Source | Load data from a feed or project file. |
| Filter | Keep or remove rows that match your conditions. |
| Clean | Fix values and column types, fill blanks, or remove duplicates. |
| Calculated Column | Add columns using formulas or existing values. |
| Join | Combine two tables using matching columns. |
| Pivot | Turn categories into columns, columns into rows, or transpose a table. |
| Group By | Summarize rows with totals, averages, counts, or other grouped values. |
| Split | Turn multiple values in one cell into separate rows. |
| Case | Set a column's value using the first matching rule. |
| Window | Compare rows using previous or next values, percent changes, or rolling averages. |
| Python | Run custom Python code on incoming rows or source files. |
| AI Assist | Use a prompt to classify or enrich rows in a new column. |
| Visualization | Preview data as a chart or table without changing it. |
| Pipeline Output | Save an output version for preview, export, or downstream use. |
Select the info icon (**Node guide**) in the pipeline toolbar for options and examples.
## Node types
| Node | Use it to |
| ----------------- | --------------------------------------------------------------------------------- |
| Source | Load data from a feed or project file. |
| Filter | Keep or remove rows that match your conditions. |
| Clean | Fix values and column types, fill blanks, or remove duplicates. |
| Calculated Column | Add columns using formulas or existing values. |
| Join | Combine two tables using matching columns. |
| Pivot | Turn categories into columns, columns into rows, or transpose a table. |
| Group By | Summarize rows with totals, averages, counts, or other grouped values. |
| Split | Turn multiple values in one cell into separate rows. |
| Case | Set a column's value using the first matching rule. |
| Window | Compare rows using previous or next values, percent changes, or rolling averages. |
| Python | Run custom Python code on incoming rows or source files. |
| AI Assist | Use a prompt to classify or enrich rows in a new column. |
| Visualization | Preview data as a chart or table without changing it. |
| Pipeline Output | Save an output version for preview, export, or downstream use. |
Select the info icon (**Node guide**) in the pipeline toolbar for options and examples.